Nicaraguan vs Indonesian Single Father Poverty
COMPARE
Nicaraguan
Indonesian
Single Father Poverty
Single Father Poverty Comparison
Nicaraguans
Indonesians
15.9%
SINGLE FATHER POVERTY
90.1/ 100
METRIC RATING
131st/ 347
METRIC RANK
17.4%
SINGLE FATHER POVERTY
0.2/ 100
METRIC RATING
270th/ 347
METRIC RANK
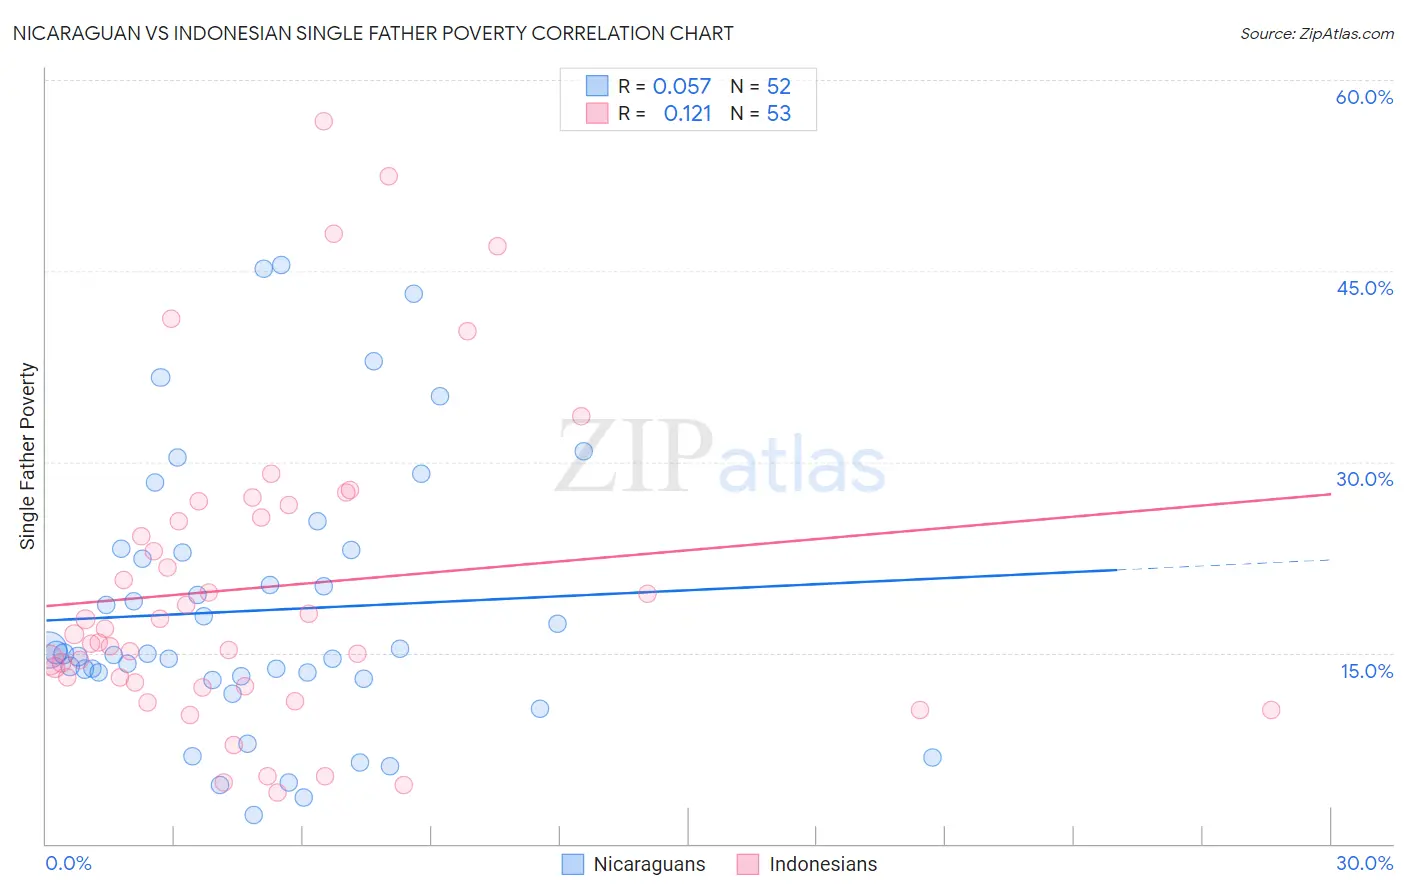
Nicaraguan vs Indonesian Single Father Poverty Correlation Chart
The statistical analysis conducted on geographies consisting of 241,925,601 people shows a slight positive correlation between the proportion of Nicaraguans and poverty level among single fathers in the United States with a correlation coefficient (R) of 0.057 and weighted average of 15.9%. Similarly, the statistical analysis conducted on geographies consisting of 143,522,675 people shows a poor positive correlation between the proportion of Indonesians and poverty level among single fathers in the United States with a correlation coefficient (R) of 0.121 and weighted average of 17.4%, a difference of 9.5%.
Single Father Poverty Correlation Summary
| Measurement | Nicaraguan | Indonesian |
| Minimum | 2.2% | 4.1% |
| Maximum | 45.5% | 56.8% |
| Range | 43.2% | 52.7% |
| Mean | 18.3% | 20.1% |
| Median | 15.0% | 16.5% |
| Interquartile 25% (IQ1) | 13.1% | 12.5% |
| Interquartile 75% (IQ3) | 23.0% | 26.1% |
| Interquartile Range (IQR) | 9.9% | 13.6% |
| Standard Deviation (Sample) | 10.6% | 12.2% |
| Standard Deviation (Population) | 10.5% | 12.1% |
Similar Demographics by Single Father Poverty
Demographics Similar to Nicaraguans by Single Father Poverty
In terms of single father poverty, the demographic groups most similar to Nicaraguans are Norwegian (15.9%, a difference of 0.0%), Immigrants from Portugal (15.9%, a difference of 0.060%), Immigrants from Syria (15.9%, a difference of 0.070%), Immigrants from West Indies (15.9%, a difference of 0.080%), and Immigrants from Nigeria (15.9%, a difference of 0.090%).
| Demographics | Rating | Rank | Single Father Poverty |
| Immigrants | Panama | 91.3 /100 | #124 | Exceptional 15.9% |
| Iraqis | 91.2 /100 | #125 | Exceptional 15.9% |
| Hmong | 91.1 /100 | #126 | Exceptional 15.9% |
| Immigrants | Liberia | 91.1 /100 | #127 | Exceptional 15.9% |
| Immigrants | Nigeria | 90.8 /100 | #128 | Exceptional 15.9% |
| Immigrants | West Indies | 90.8 /100 | #129 | Exceptional 15.9% |
| Norwegians | 90.2 /100 | #130 | Exceptional 15.9% |
| Nicaraguans | 90.1 /100 | #131 | Exceptional 15.9% |
| Immigrants | Portugal | 89.7 /100 | #132 | Excellent 15.9% |
| Immigrants | Syria | 89.5 /100 | #133 | Excellent 15.9% |
| Immigrants | South America | 88.5 /100 | #134 | Excellent 15.9% |
| Immigrants | Sri Lanka | 88.2 /100 | #135 | Excellent 15.9% |
| Cypriots | 87.5 /100 | #136 | Excellent 15.9% |
| Immigrants | Azores | 87.2 /100 | #137 | Excellent 15.9% |
| Central Americans | 87.1 /100 | #138 | Excellent 16.0% |
Demographics Similar to Indonesians by Single Father Poverty
In terms of single father poverty, the demographic groups most similar to Indonesians are French American Indian (17.4%, a difference of 0.14%), Slavic (17.4%, a difference of 0.26%), Immigrants from Caribbean (17.4%, a difference of 0.33%), Haitian (17.3%, a difference of 0.43%), and Jamaican (17.3%, a difference of 0.47%).
| Demographics | Rating | Rank | Single Father Poverty |
| Lithuanians | 0.4 /100 | #263 | Tragic 17.3% |
| Slovenes | 0.3 /100 | #264 | Tragic 17.3% |
| Poles | 0.3 /100 | #265 | Tragic 17.3% |
| Jamaicans | 0.3 /100 | #266 | Tragic 17.3% |
| Haitians | 0.3 /100 | #267 | Tragic 17.3% |
| Immigrants | Caribbean | 0.3 /100 | #268 | Tragic 17.4% |
| Slavs | 0.3 /100 | #269 | Tragic 17.4% |
| Indonesians | 0.2 /100 | #270 | Tragic 17.4% |
| French American Indians | 0.2 /100 | #271 | Tragic 17.4% |
| Barbadians | 0.1 /100 | #272 | Tragic 17.5% |
| Italians | 0.1 /100 | #273 | Tragic 17.5% |
| Macedonians | 0.1 /100 | #274 | Tragic 17.7% |
| British West Indians | 0.0 /100 | #275 | Tragic 17.7% |
| German Russians | 0.0 /100 | #276 | Tragic 17.7% |
| Lebanese | 0.0 /100 | #277 | Tragic 17.7% |