Nicaraguan vs Serbian Single Father Poverty
COMPARE
Nicaraguan
Serbian
Single Father Poverty
Single Father Poverty Comparison
Nicaraguans
Serbians
15.9%
SINGLE FATHER POVERTY
90.1/ 100
METRIC RATING
131st/ 347
METRIC RANK
16.4%
SINGLE FATHER POVERTY
40.9/ 100
METRIC RATING
179th/ 347
METRIC RANK
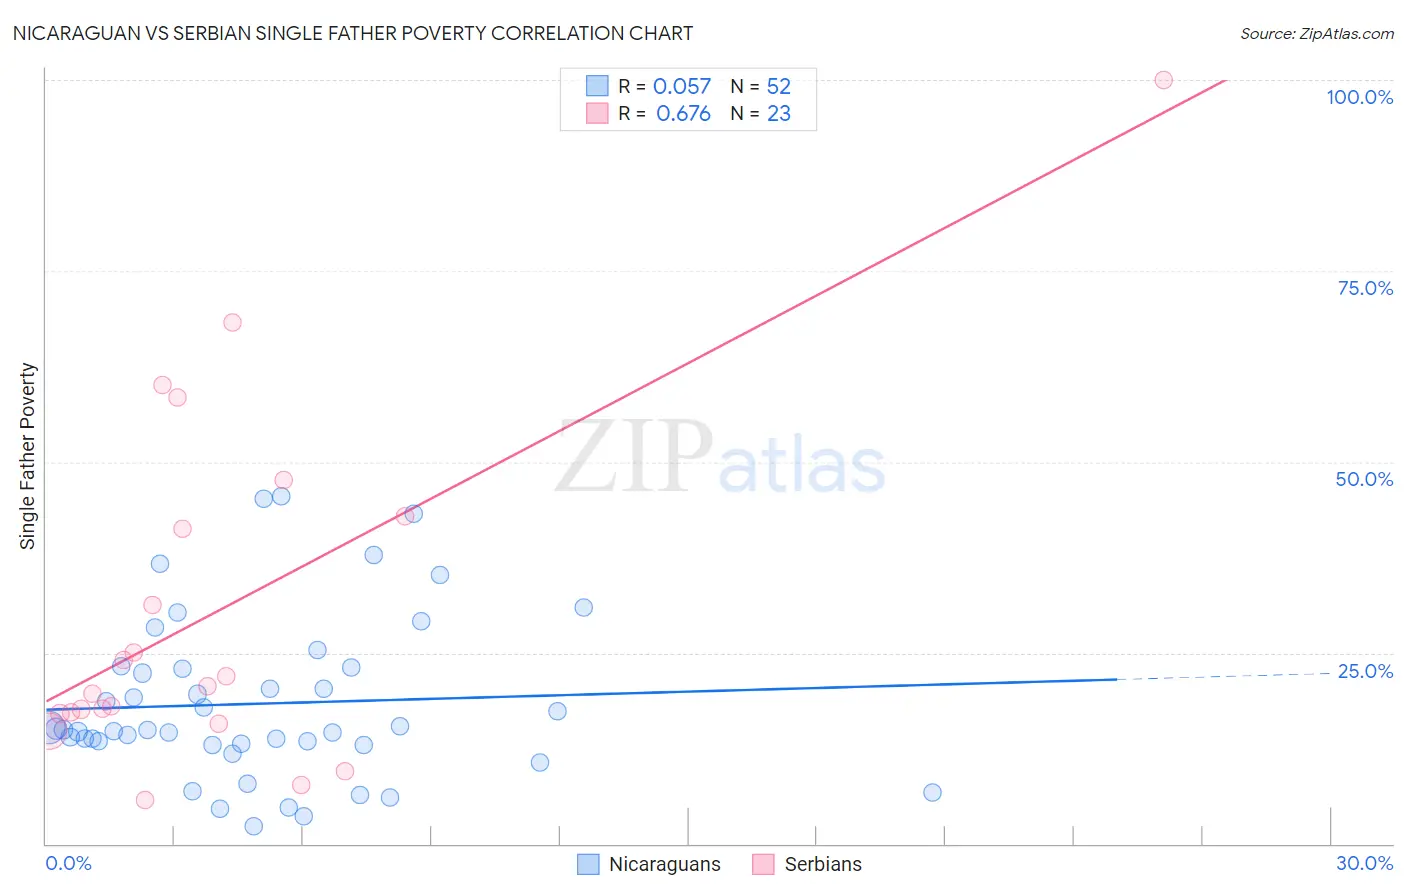
Nicaraguan vs Serbian Single Father Poverty Correlation Chart
The statistical analysis conducted on geographies consisting of 241,925,601 people shows a slight positive correlation between the proportion of Nicaraguans and poverty level among single fathers in the United States with a correlation coefficient (R) of 0.057 and weighted average of 15.9%. Similarly, the statistical analysis conducted on geographies consisting of 216,450,025 people shows a significant positive correlation between the proportion of Serbians and poverty level among single fathers in the United States with a correlation coefficient (R) of 0.676 and weighted average of 16.4%, a difference of 2.9%.
Single Father Poverty Correlation Summary
| Measurement | Nicaraguan | Serbian |
| Minimum | 2.2% | 5.7% |
| Maximum | 45.5% | 100.0% |
| Range | 43.2% | 94.3% |
| Mean | 18.3% | 30.5% |
| Median | 15.0% | 20.7% |
| Interquartile 25% (IQ1) | 13.1% | 17.0% |
| Interquartile 75% (IQ3) | 23.0% | 42.9% |
| Interquartile Range (IQR) | 9.9% | 25.8% |
| Standard Deviation (Sample) | 10.6% | 23.1% |
| Standard Deviation (Population) | 10.5% | 22.6% |
Similar Demographics by Single Father Poverty
Demographics Similar to Nicaraguans by Single Father Poverty
In terms of single father poverty, the demographic groups most similar to Nicaraguans are Norwegian (15.9%, a difference of 0.0%), Immigrants from Portugal (15.9%, a difference of 0.060%), Immigrants from Syria (15.9%, a difference of 0.070%), Immigrants from West Indies (15.9%, a difference of 0.080%), and Immigrants from Nigeria (15.9%, a difference of 0.090%).
| Demographics | Rating | Rank | Single Father Poverty |
| Immigrants | Panama | 91.3 /100 | #124 | Exceptional 15.9% |
| Iraqis | 91.2 /100 | #125 | Exceptional 15.9% |
| Hmong | 91.1 /100 | #126 | Exceptional 15.9% |
| Immigrants | Liberia | 91.1 /100 | #127 | Exceptional 15.9% |
| Immigrants | Nigeria | 90.8 /100 | #128 | Exceptional 15.9% |
| Immigrants | West Indies | 90.8 /100 | #129 | Exceptional 15.9% |
| Norwegians | 90.2 /100 | #130 | Exceptional 15.9% |
| Nicaraguans | 90.1 /100 | #131 | Exceptional 15.9% |
| Immigrants | Portugal | 89.7 /100 | #132 | Excellent 15.9% |
| Immigrants | Syria | 89.5 /100 | #133 | Excellent 15.9% |
| Immigrants | South America | 88.5 /100 | #134 | Excellent 15.9% |
| Immigrants | Sri Lanka | 88.2 /100 | #135 | Excellent 15.9% |
| Cypriots | 87.5 /100 | #136 | Excellent 15.9% |
| Immigrants | Azores | 87.2 /100 | #137 | Excellent 15.9% |
| Central Americans | 87.1 /100 | #138 | Excellent 16.0% |
Demographics Similar to Serbians by Single Father Poverty
In terms of single father poverty, the demographic groups most similar to Serbians are Immigrants from Cuba (16.4%, a difference of 0.030%), Immigrants from South Africa (16.3%, a difference of 0.15%), Immigrants from Latin America (16.4%, a difference of 0.17%), Immigrants from Western Africa (16.4%, a difference of 0.23%), and Immigrants from Italy (16.4%, a difference of 0.24%).
| Demographics | Rating | Rank | Single Father Poverty |
| Immigrants | Sierra Leone | 50.1 /100 | #172 | Average 16.3% |
| Immigrants | St. Vincent and the Grenadines | 50.0 /100 | #173 | Average 16.3% |
| Swedes | 50.0 /100 | #174 | Average 16.3% |
| Immigrants | Ecuador | 49.7 /100 | #175 | Average 16.3% |
| Vietnamese | 48.0 /100 | #176 | Average 16.3% |
| Immigrants | South Africa | 44.2 /100 | #177 | Average 16.3% |
| Immigrants | Cuba | 41.6 /100 | #178 | Average 16.4% |
| Serbians | 40.9 /100 | #179 | Average 16.4% |
| Immigrants | Latin America | 37.2 /100 | #180 | Fair 16.4% |
| Immigrants | Western Africa | 36.0 /100 | #181 | Fair 16.4% |
| Immigrants | Italy | 35.7 /100 | #182 | Fair 16.4% |
| Aleuts | 35.3 /100 | #183 | Fair 16.4% |
| Cambodians | 34.6 /100 | #184 | Fair 16.4% |
| Panamanians | 33.6 /100 | #185 | Fair 16.4% |
| Immigrants | Venezuela | 31.0 /100 | #186 | Fair 16.4% |