New Zealander vs Austrian Married-Couple Family Poverty

COMPARE

New Zealander
Race
Ancestry
AfghanAfricanAlaska NativeAlaskan AthabascanAlbanianAleutAlsatianAmericanApacheArabArapahoArgentineanArmenianAssyrian/Chaldean/SyriacAustralianBahamianBangladeshiBarbadianBasqueBelgianBelizeanBermudanBhutaneseBlackfeetBolivianBrazilianBritishBritish West IndianBulgarianBurmeseCajunCambodianCanadianCape VerdeanCarpatho RusynCelticCentral AmericanCentral American IndianCherokeeCheyenneChickasawChileanChineseChippewaChoctawColombianColvilleComancheCosta RicanCreeCreekCroatianCrowCubanCypriotCzechCzechoslovakianDanishDelawareDominicanDutchDutch West IndianEastern EuropeanEcuadorianEgyptianEnglishEstonianEthiopianEuropeanFijianFilipinoFinnishFrenchFrench American IndianFrench CanadianGermanGerman RussianGhanaianGreekGuamanian/ChamorroGuatemalanGuyaneseHaitianHmongHonduranHopiHoumaHungarianIcelanderIndian (Asian)IndonesianInupiatIranianIraqiIrishIroquoisIsraeliItalianJamaicanJapaneseJordanianKenyanKiowaKoreanLaotianLatvianLebaneseLiberianLithuanianLumbeeLuxembourgerMacedonianMalaysianMalteseMarshalleseMenomineeMexicanMexican American IndianMongolianMoroccanNative HawaiianNavajoNepaleseNew ZealanderNicaraguanNigerianNorthern EuropeanNorwegianOkinawanOsageOttawaPaiutePakistaniPalestinianPanamanianParaguayanPennsylvania GermanPeruvianPimaPolishPortuguesePotawatomiPuebloPuerto RicanPuget Sound SalishRomanianRussianSalvadoranSamoanScandinavianScotch-IrishScottishSeminoleSenegaleseSerbianShoshoneSierra LeoneanSiouxSlavicSlovakSloveneSomaliSouth AfricanSouth AmericanSouth American IndianSoviet UnionSpaniardSpanishSpanish AmericanSpanish American IndianSri LankanSubsaharan AfricanSudaneseSwedishSwissSyrianTaiwaneseThaiTlingit-HaidaTohono O'OdhamTonganTrinidadian and TobagonianTsimshianTurkishU.S. Virgin IslanderUgandanUkrainianUruguayanUteVenezuelanVietnameseWelshWest IndianYakamaYaquiYugoslavianYumanYup'ikZimbabwean
Immigration
NonimmigrantsImmigrantsAfghanistanAfricaAlbaniaArgentinaArmeniaAsiaAustraliaAustriaBahamasBangladeshBarbadosBelarusBelgiumBelizeBoliviaBosnia and HerzegovinaBrazilBulgariaBurma/MyanmarCabo VerdeCambodiaCameroonCanadaCaribbeanCentral AmericaChileChinaColombiaCongoCosta RicaCroatiaCubaCzechoslovakiaDenmarkDominicaDominican RepublicEastern AfricaEastern AsiaEastern EuropeEcuadorEgyptEl SalvadorEnglandEritreaEthiopiaEuropeFijiFranceGermanyGhanaGreeceGrenadaGuatemalaGuyanaHaitiHondurasHong KongHungaryIndiaIndonesiaIranIraqIrelandIsraelItalyJamaicaJapanJordanKazakhstanKenyaKoreaKuwaitLaosLatin AmericaLatviaLebanonLiberiaLithuaniaMalaysiaMexicoMicronesiaMiddle AfricaMoldovaMoroccoNepalNetherlandsNicaraguaNigeriaNorth AmericaNorth MacedoniaNorthern AfricaNorthern EuropeNorwayOceaniaPakistanPanamaPeruPhilippinesPolandPortugalRomaniaRussiaSaudi ArabiaScotlandSenegalSerbiaSierra LeoneSingaporeSomaliaSouth AfricaSouth AmericaSouth Central AsiaSouth Eastern AsiaSouthern EuropeSpainSri LankaSt. Vincent and the GrenadinesSudanSwedenSwitzerlandSyriaTaiwanThailandTrinidad and TobagoTurkeyUgandaUkraineUruguayUzbekistanVenezuelaVietnamWest IndiesWestern AfricaWestern AsiaWestern EuropeYemenZaireZimbabweAzores
Austrian
Race
Ancestry
AfghanAfricanAlaska NativeAlaskan AthabascanAlbanianAleutAlsatianAmericanApacheArabArapahoArgentineanArmenianAssyrian/Chaldean/SyriacAustralianAustrianBahamianBangladeshiBarbadianBasqueBelgianBelizeanBermudanBhutaneseBlackfeetBolivianBrazilianBritishBritish West IndianBulgarianBurmeseCajunCambodianCanadianCape VerdeanCarpatho RusynCelticCentral AmericanCentral American IndianCherokeeCheyenneChickasawChileanChineseChippewaChoctawColombianColvilleComancheCosta RicanCreeCreekCroatianCrowCubanCypriotCzechCzechoslovakianDanishDelawareDominicanDutchDutch West IndianEastern EuropeanEcuadorianEgyptianEnglishEstonianEthiopianEuropeanFijianFilipinoFinnishFrenchFrench American IndianFrench CanadianGermanGerman RussianGhanaianGreekGuamanian/ChamorroGuatemalanGuyaneseHaitianHmongHonduranHopiHoumaHungarianIcelanderIndian (Asian)IndonesianInupiatIranianIraqiIrishIroquoisIsraeliItalianJamaicanJapaneseJordanianKenyanKiowaKoreanLaotianLatvianLebaneseLiberianLithuanianLumbeeLuxembourgerMacedonianMalaysianMalteseMarshalleseMenomineeMexicanMexican American IndianMongolianMoroccanNative HawaiianNavajoNepaleseNicaraguanNigerianNorthern EuropeanNorwegianOkinawanOsageOttawaPaiutePakistaniPalestinianPanamanianParaguayanPennsylvania GermanPeruvianPimaPolishPortuguesePotawatomiPuebloPuerto RicanPuget Sound SalishRomanianRussianSalvadoranSamoanScandinavianScotch-IrishScottishSeminoleSenegaleseSerbianShoshoneSierra LeoneanSiouxSlavicSlovakSloveneSomaliSouth AfricanSouth AmericanSouth American IndianSoviet UnionSpaniardSpanishSpanish AmericanSpanish American IndianSri LankanSubsaharan AfricanSudaneseSwedishSwissSyrianTaiwaneseThaiTlingit-HaidaTohono O'OdhamTonganTrinidadian and TobagonianTsimshianTurkishU.S. Virgin IslanderUgandanUkrainianUruguayanUteVenezuelanVietnameseWelshWest IndianYakamaYaquiYugoslavianYumanYup'ikZimbabwean
Immigration
NonimmigrantsImmigrantsAfghanistanAfricaAlbaniaArgentinaArmeniaAsiaAustraliaAustriaBahamasBangladeshBarbadosBelarusBelgiumBelizeBoliviaBosnia and HerzegovinaBrazilBulgariaBurma/MyanmarCabo VerdeCambodiaCameroonCanadaCaribbeanCentral AmericaChileChinaColombiaCongoCosta RicaCroatiaCubaCzechoslovakiaDenmarkDominicaDominican RepublicEastern AfricaEastern AsiaEastern EuropeEcuadorEgyptEl SalvadorEnglandEritreaEthiopiaEuropeFijiFranceGermanyGhanaGreeceGrenadaGuatemalaGuyanaHaitiHondurasHong KongHungaryIndiaIndonesiaIranIraqIrelandIsraelItalyJamaicaJapanJordanKazakhstanKenyaKoreaKuwaitLaosLatin AmericaLatviaLebanonLiberiaLithuaniaMalaysiaMexicoMicronesiaMiddle AfricaMoldovaMoroccoNepalNetherlandsNicaraguaNigeriaNorth AmericaNorth MacedoniaNorthern AfricaNorthern EuropeNorwayOceaniaPakistanPanamaPeruPhilippinesPolandPortugalRomaniaRussiaSaudi ArabiaScotlandSenegalSerbiaSierra LeoneSingaporeSomaliaSouth AfricaSouth AmericaSouth Central AsiaSouth Eastern AsiaSouthern EuropeSpainSri LankaSt. Vincent and the GrenadinesSudanSwedenSwitzerlandSyriaTaiwanThailandTrinidad and TobagoTurkeyUgandaUkraineUruguayUzbekistanVenezuelaVietnamWest IndiesWestern AfricaWestern AsiaWestern EuropeYemenZaireZimbabweAzores
Married-Couple Family Poverty
Income
Poverty
Unemployment
Labor Participation
Family Structure
Vehicle Availability
Education Level
Disability

Married-Couple Family Poverty Comparison

New Zealanders

Austrians

Exceptional
Exceptional
4.4%
MARRIED-COUPLE FAMILY POVERTY
99.4/ 100
METRIC RATING
69th/ 347
METRIC RANK
4.3%
MARRIED-COUPLE FAMILY POVERTY
99.7/ 100
METRIC RATING
54th/ 347
METRIC RANK

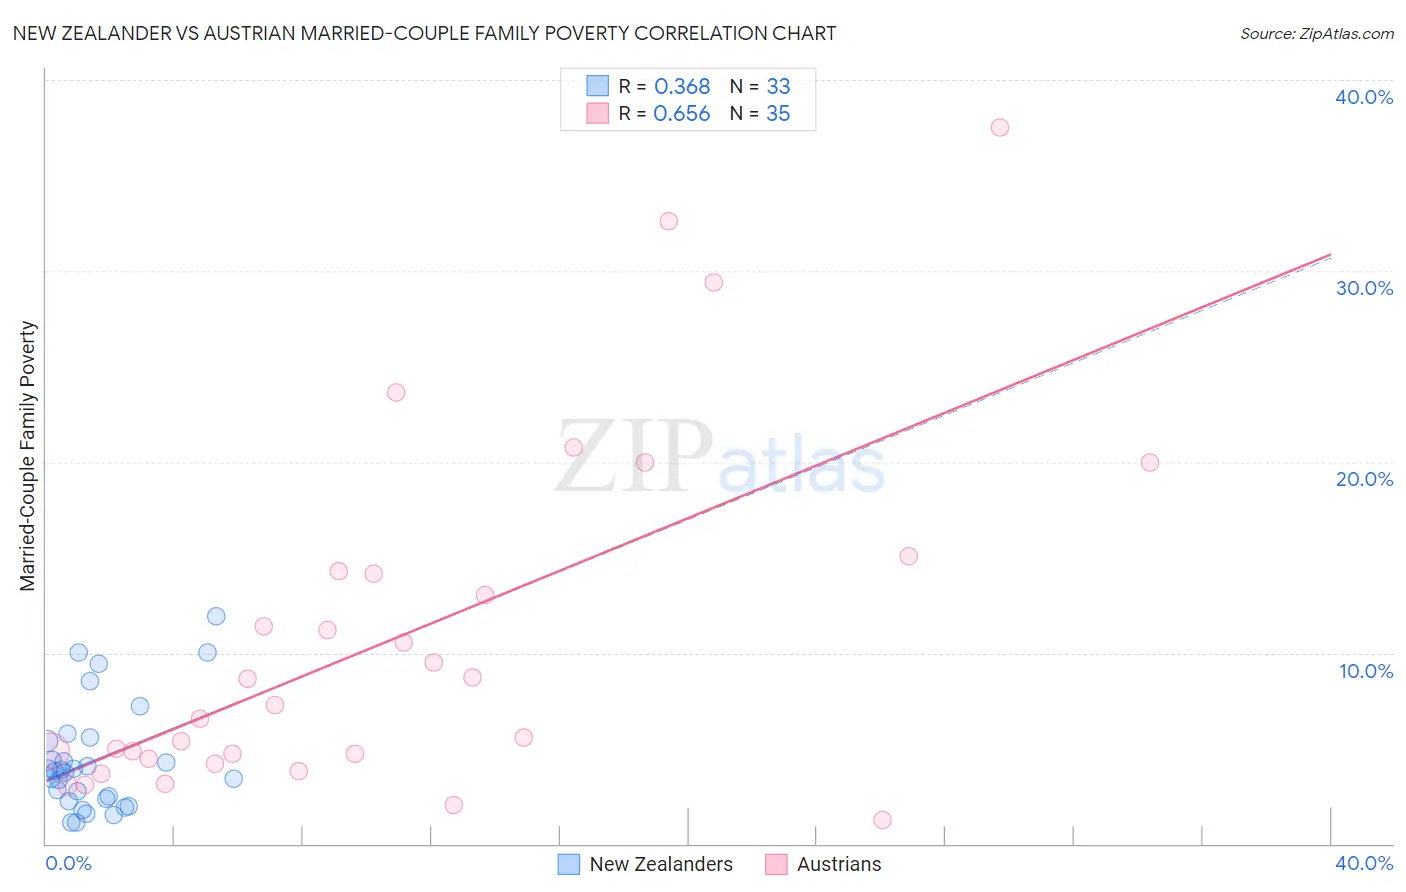
New Zealander vs Austrian Married-Couple Family Poverty Correlation Chart

The statistical analysis conducted on geographies consisting of 106,591,527 people shows a mild positive correlation between the proportion of New Zealanders and poverty level among married-couple families in the United States with a correlation coefficient (R) of 0.368 and weighted average of 4.4%. Similarly, the statistical analysis conducted on geographies consisting of 445,465,391 people shows a significant positive correlation between the proportion of Austrians and poverty level among married-couple families in the United States with a correlation coefficient (R) of 0.656 and weighted average of 4.3%, a difference of 2.5%.
New Zealander vs Austrian Married-Couple Family Poverty

Married-Couple Family Poverty Correlation Summary

MeasurementNew ZealanderAustrian
Minimum1.1%1.3%
Maximum11.9%37.5%
Range10.8%36.2%
Mean4.4%10.8%
Median3.8%7.2%
Interquartile 25% (IQ1)2.3%4.5%
Interquartile 75% (IQ3)5.5%14.3%
Interquartile Range (IQR)3.2%9.8%
Standard Deviation (Sample)2.8%9.1%
Standard Deviation (Population)2.8%9.0%

Demographics Similar to New Zealanders and Austrians by Married-Couple Family Poverty

In terms of married-couple family poverty, the demographic groups most similar to New Zealanders are Slavic (4.4%, a difference of 0.010%), Immigrants from Canada (4.4%, a difference of 0.030%), Immigrants from Serbia (4.4%, a difference of 0.070%), Immigrants from Korea (4.5%, a difference of 0.13%), and Macedonian (4.4%, a difference of 0.20%). Similarly, the demographic groups most similar to Austrians are French (4.3%, a difference of 0.020%), Immigrants from Zimbabwe (4.3%, a difference of 0.18%), Immigrants from Netherlands (4.3%, a difference of 0.18%), Welsh (4.3%, a difference of 0.26%), and Czechoslovakian (4.4%, a difference of 0.27%).
DemographicsRating | RankMarried-Couple Family Poverty
Immigrants | Lithuania
99.7
/100
|
#51
Exceptional
4.3%
Russians
99.7
/100
|
#52
Exceptional
4.3%
Welsh
99.7
/100
|
#53
Exceptional
4.3%
Austrians
99.7
/100
|
#54
Exceptional
4.3%
French
99.7
/100
|
#55
Exceptional
4.3%
Immigrants | Zimbabwe
99.7
/100
|
#56
Exceptional
4.3%
Immigrants | Netherlands
99.7
/100
|
#57
Exceptional
4.3%
Czechoslovakians
99.7
/100
|
#58
Exceptional
4.4%
Immigrants | Sweden
99.6
/100
|
#59
Exceptional
4.4%
Tlingit-Haida
99.6
/100
|
#60
Exceptional
4.4%
Okinawans
99.6
/100
|
#61
Exceptional
4.4%
Immigrants | Australia
99.6
/100
|
#62
Exceptional
4.4%
Immigrants | Sri Lanka
99.6
/100
|
#63
Exceptional
4.4%
Immigrants | Bulgaria
99.5
/100
|
#64
Exceptional
4.4%
Macedonians
99.4
/100
|
#65
Exceptional
4.4%
Immigrants | Serbia
99.4
/100
|
#66
Exceptional
4.4%
Immigrants | Canada
99.4
/100
|
#67
Exceptional
4.4%
Slavs
99.4
/100
|
#68
Exceptional
4.4%
New Zealanders
99.4
/100
|
#69
Exceptional
4.4%
Immigrants | Korea
99.4
/100
|
#70
Exceptional
4.5%
Immigrants | North America
99.3
/100
|
#71
Exceptional
4.5%