Navajo vs Portuguese Ambulatory Disability
COMPARE
Navajo
Portuguese
Ambulatory Disability
Ambulatory Disability Comparison
Navajo
Portuguese
7.5%
AMBULATORY DISABILITY
0.0/ 100
METRIC RATING
324th/ 347
METRIC RANK
6.4%
AMBULATORY DISABILITY
4.0/ 100
METRIC RATING
228th/ 347
METRIC RANK
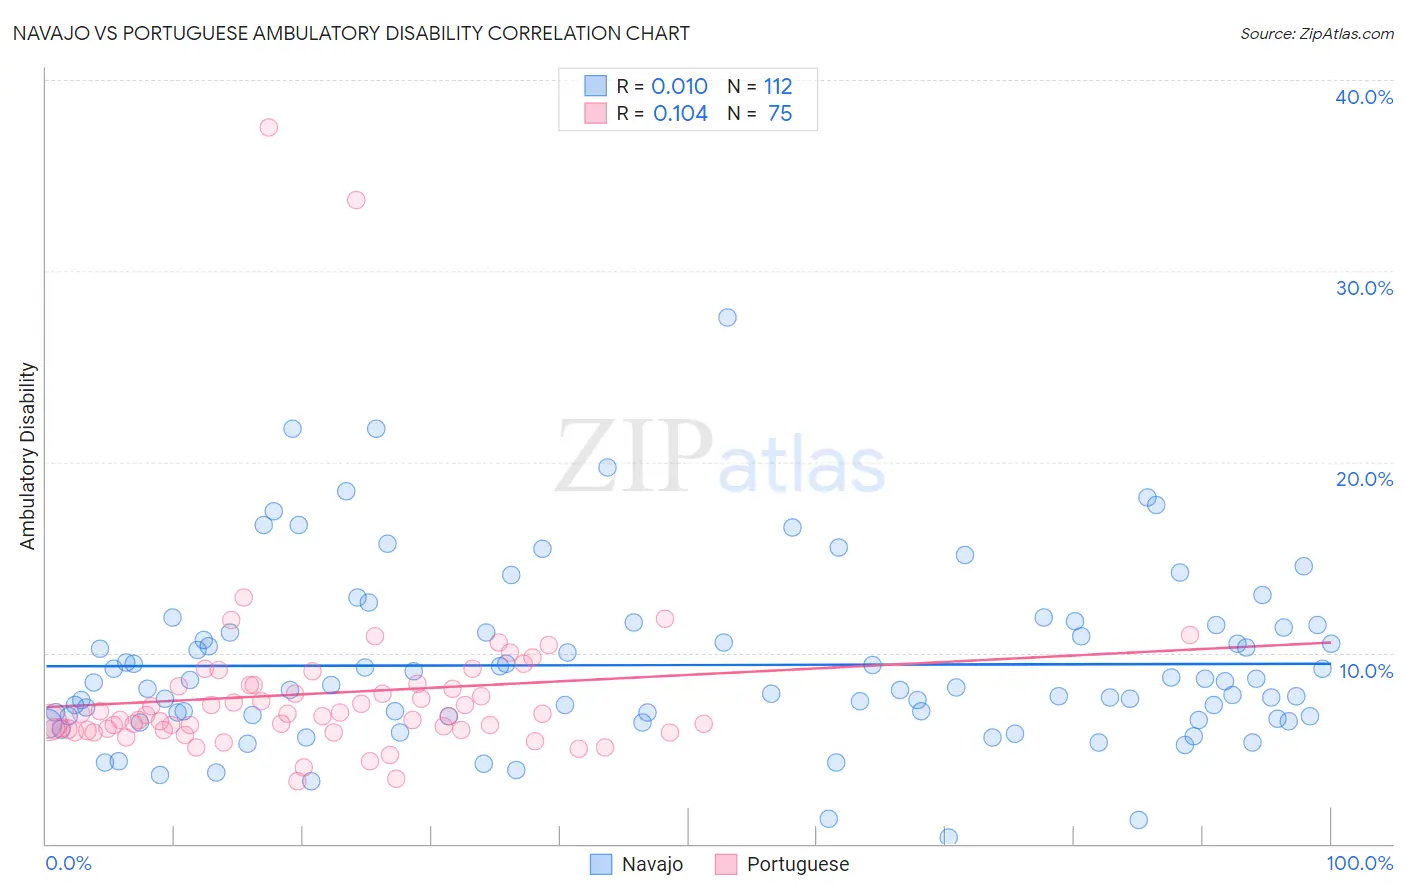
Navajo vs Portuguese Ambulatory Disability Correlation Chart
The statistical analysis conducted on geographies consisting of 224,747,889 people shows no correlation between the proportion of Navajo and percentage of population with ambulatory disability in the United States with a correlation coefficient (R) of 0.010 and weighted average of 7.5%. Similarly, the statistical analysis conducted on geographies consisting of 450,087,424 people shows a poor positive correlation between the proportion of Portuguese and percentage of population with ambulatory disability in the United States with a correlation coefficient (R) of 0.104 and weighted average of 6.4%, a difference of 17.7%.
Ambulatory Disability Correlation Summary
| Measurement | Navajo | Portuguese |
| Minimum | 0.36% | 3.3% |
| Maximum | 27.6% | 37.5% |
| Range | 27.2% | 34.2% |
| Mean | 9.4% | 7.9% |
| Median | 8.3% | 6.7% |
| Interquartile 25% (IQ1) | 6.7% | 6.0% |
| Interquartile 75% (IQ3) | 11.2% | 8.3% |
| Interquartile Range (IQR) | 4.5% | 2.3% |
| Standard Deviation (Sample) | 4.5% | 5.0% |
| Standard Deviation (Population) | 4.5% | 5.0% |
Similar Demographics by Ambulatory Disability
Demographics Similar to Navajo by Ambulatory Disability
In terms of ambulatory disability, the demographic groups most similar to Navajo are Comanche (7.5%, a difference of 0.070%), Black/African American (7.5%, a difference of 0.18%), Native/Alaskan (7.5%, a difference of 0.20%), Hopi (7.6%, a difference of 1.1%), and Pueblo (7.6%, a difference of 1.2%).
| Demographics | Rating | Rank | Ambulatory Disability |
| Central American Indians | 0.0 /100 | #317 | Tragic 7.2% |
| Ottawa | 0.0 /100 | #318 | Tragic 7.2% |
| Dominicans | 0.0 /100 | #319 | Tragic 7.2% |
| Potawatomi | 0.0 /100 | #320 | Tragic 7.3% |
| Apache | 0.0 /100 | #321 | Tragic 7.4% |
| Osage | 0.0 /100 | #322 | Tragic 7.4% |
| Americans | 0.0 /100 | #323 | Tragic 7.4% |
| Navajo | 0.0 /100 | #324 | Tragic 7.5% |
| Comanche | 0.0 /100 | #325 | Tragic 7.5% |
| Blacks/African Americans | 0.0 /100 | #326 | Tragic 7.5% |
| Natives/Alaskans | 0.0 /100 | #327 | Tragic 7.5% |
| Hopi | 0.0 /100 | #328 | Tragic 7.6% |
| Pueblo | 0.0 /100 | #329 | Tragic 7.6% |
| Paiute | 0.0 /100 | #330 | Tragic 7.7% |
| Cajuns | 0.0 /100 | #331 | Tragic 7.8% |
Demographics Similar to Portuguese by Ambulatory Disability
In terms of ambulatory disability, the demographic groups most similar to Portuguese are Cuban (6.4%, a difference of 0.010%), Czechoslovakian (6.4%, a difference of 0.050%), Mexican (6.4%, a difference of 0.15%), Panamanian (6.4%, a difference of 0.31%), and Slavic (6.4%, a difference of 0.34%).
| Demographics | Rating | Rank | Ambulatory Disability |
| Hungarians | 9.6 /100 | #221 | Tragic 6.3% |
| German Russians | 9.4 /100 | #222 | Tragic 6.3% |
| Immigrants | Honduras | 7.6 /100 | #223 | Tragic 6.3% |
| Liberians | 7.1 /100 | #224 | Tragic 6.3% |
| Hondurans | 6.3 /100 | #225 | Tragic 6.3% |
| Slavs | 5.1 /100 | #226 | Tragic 6.4% |
| Cubans | 4.0 /100 | #227 | Tragic 6.4% |
| Portuguese | 4.0 /100 | #228 | Tragic 6.4% |
| Czechoslovakians | 3.8 /100 | #229 | Tragic 6.4% |
| Mexicans | 3.5 /100 | #230 | Tragic 6.4% |
| Panamanians | 3.1 /100 | #231 | Tragic 6.4% |
| Assyrians/Chaldeans/Syriacs | 2.4 /100 | #232 | Tragic 6.4% |
| Sub-Saharan Africans | 2.3 /100 | #233 | Tragic 6.4% |
| Immigrants | Liberia | 2.3 /100 | #234 | Tragic 6.4% |
| Hispanics or Latinos | 2.2 /100 | #235 | Tragic 6.4% |