Navajo vs Immigrants from El Salvador Disability Age 18 to 34
COMPARE
Navajo
Immigrants from El Salvador
Disability Age 18 to 34
Disability Age 18 to 34 Comparison
Navajo
Immigrants from El Salvador
8.1%
DISABILITY AGE 18 TO 34
0.0/ 100
METRIC RATING
320th/ 347
METRIC RANK
5.9%
DISABILITY AGE 18 TO 34
99.8/ 100
METRIC RATING
50th/ 347
METRIC RANK
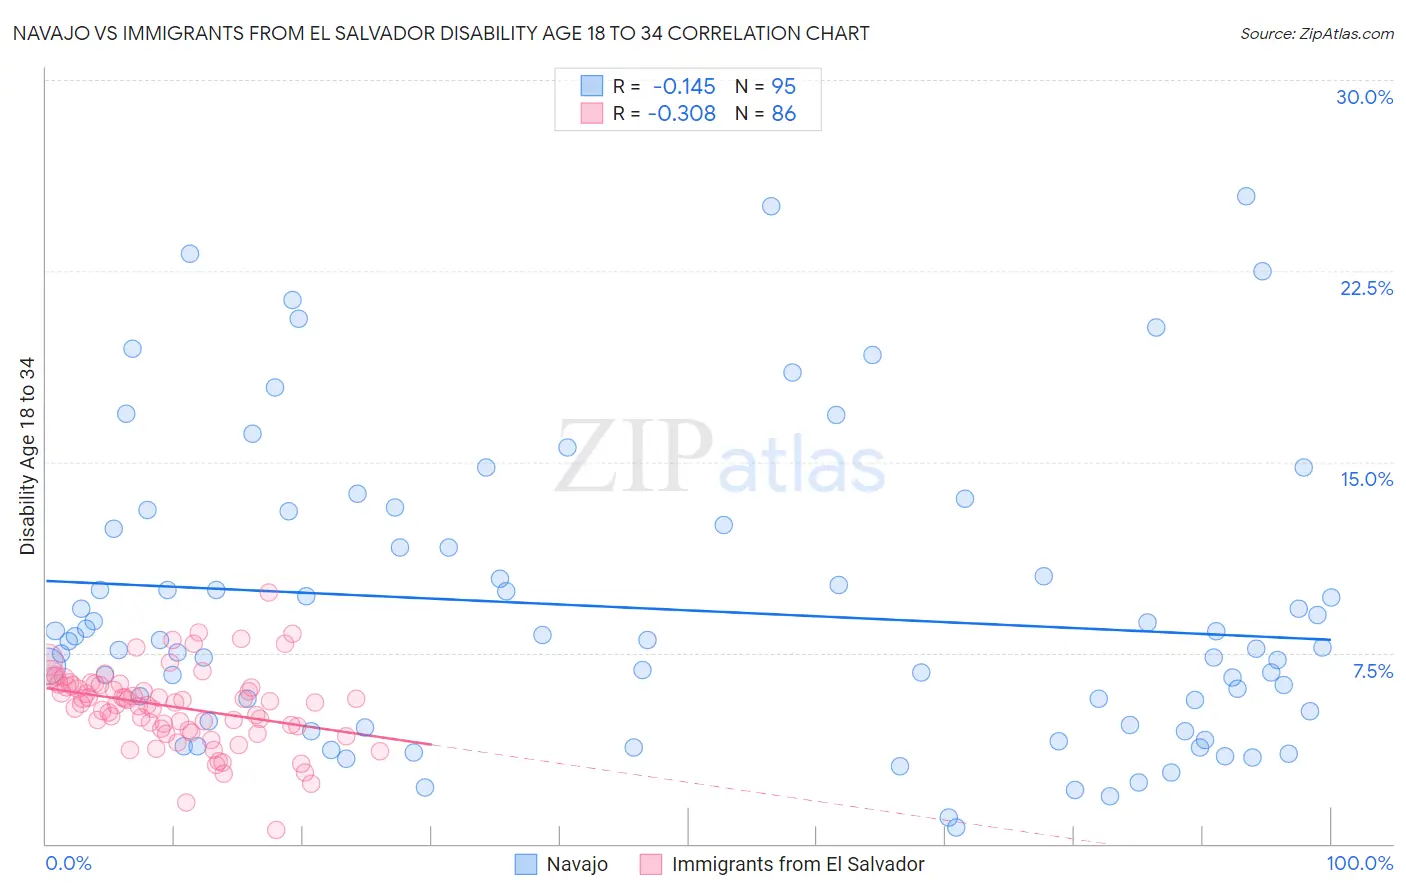
Navajo vs Immigrants from El Salvador Disability Age 18 to 34 Correlation Chart
The statistical analysis conducted on geographies consisting of 224,432,910 people shows a poor negative correlation between the proportion of Navajo and percentage of population with a disability between the ages 18 and 35 in the United States with a correlation coefficient (R) of -0.145 and weighted average of 8.1%. Similarly, the statistical analysis conducted on geographies consisting of 357,256,884 people shows a mild negative correlation between the proportion of Immigrants from El Salvador and percentage of population with a disability between the ages 18 and 35 in the United States with a correlation coefficient (R) of -0.308 and weighted average of 5.9%, a difference of 37.0%.
Disability Age 18 to 34 Correlation Summary
| Measurement | Navajo | Immigrants from El Salvador |
| Minimum | 0.64% | 0.54% |
| Maximum | 25.5% | 9.9% |
| Range | 24.8% | 9.3% |
| Mean | 9.2% | 5.4% |
| Median | 7.9% | 5.5% |
| Interquartile 25% (IQ1) | 4.7% | 4.5% |
| Interquartile 75% (IQ3) | 12.3% | 6.3% |
| Interquartile Range (IQR) | 7.7% | 1.7% |
| Standard Deviation (Sample) | 5.7% | 1.5% |
| Standard Deviation (Population) | 5.7% | 1.5% |
Similar Demographics by Disability Age 18 to 34
Demographics Similar to Navajo by Disability Age 18 to 34
In terms of disability age 18 to 34, the demographic groups most similar to Navajo are Aleut (8.1%, a difference of 0.050%), French Canadian (8.1%, a difference of 0.090%), Blackfeet (8.1%, a difference of 0.36%), Cree (8.1%, a difference of 0.42%), and Hmong (8.1%, a difference of 0.51%).
| Demographics | Rating | Rank | Disability Age 18 to 34 |
| Iroquois | 0.0 /100 | #313 | Tragic 7.9% |
| Colville | 0.0 /100 | #314 | Tragic 7.9% |
| Americans | 0.0 /100 | #315 | Tragic 8.0% |
| Puerto Ricans | 0.0 /100 | #316 | Tragic 8.0% |
| Hmong | 0.0 /100 | #317 | Tragic 8.1% |
| French Canadians | 0.0 /100 | #318 | Tragic 8.1% |
| Aleuts | 0.0 /100 | #319 | Tragic 8.1% |
| Navajo | 0.0 /100 | #320 | Tragic 8.1% |
| Blackfeet | 0.0 /100 | #321 | Tragic 8.1% |
| Cree | 0.0 /100 | #322 | Tragic 8.1% |
| French American Indians | 0.0 /100 | #323 | Tragic 8.2% |
| Cajuns | 0.0 /100 | #324 | Tragic 8.2% |
| Natives/Alaskans | 0.0 /100 | #325 | Tragic 8.2% |
| Potawatomi | 0.0 /100 | #326 | Tragic 8.2% |
| Sioux | 0.0 /100 | #327 | Tragic 8.2% |
Demographics Similar to Immigrants from El Salvador by Disability Age 18 to 34
In terms of disability age 18 to 34, the demographic groups most similar to Immigrants from El Salvador are Egyptian (5.9%, a difference of 0.0%), Immigrants from Belarus (5.9%, a difference of 0.040%), Immigrants from Trinidad and Tobago (5.9%, a difference of 0.14%), Okinawan (5.9%, a difference of 0.14%), and Immigrants from Indonesia (5.9%, a difference of 0.28%).
| Demographics | Rating | Rank | Disability Age 18 to 34 |
| South Americans | 99.8 /100 | #43 | Exceptional 5.9% |
| Immigrants | Asia | 99.8 /100 | #44 | Exceptional 5.9% |
| Immigrants | Peru | 99.8 /100 | #45 | Exceptional 5.9% |
| Immigrants | Korea | 99.8 /100 | #46 | Exceptional 5.9% |
| Immigrants | Egypt | 99.8 /100 | #47 | Exceptional 5.9% |
| Immigrants | Trinidad and Tobago | 99.8 /100 | #48 | Exceptional 5.9% |
| Immigrants | Belarus | 99.8 /100 | #49 | Exceptional 5.9% |
| Immigrants | El Salvador | 99.8 /100 | #50 | Exceptional 5.9% |
| Egyptians | 99.8 /100 | #51 | Exceptional 5.9% |
| Okinawans | 99.7 /100 | #52 | Exceptional 5.9% |
| Immigrants | Indonesia | 99.7 /100 | #53 | Exceptional 5.9% |
| Immigrants | Malaysia | 99.7 /100 | #54 | Exceptional 5.9% |
| Immigrants | Spain | 99.7 /100 | #55 | Exceptional 5.9% |
| Paraguayans | 99.7 /100 | #56 | Exceptional 5.9% |
| Immigrants | Haiti | 99.7 /100 | #57 | Exceptional 5.9% |