Native/Alaskan vs Iroquois Child Poverty Among Boys Under 16
COMPARE
Native/Alaskan
Iroquois
Child Poverty Among Boys Under 16
Child Poverty Among Boys Under 16 Comparison
Natives/Alaskans
Iroquois
24.0%
CHILD POVERTY AMONG BOYS UNDER 16
0.0/ 100
METRIC RATING
329th/ 347
METRIC RANK
19.6%
CHILD POVERTY AMONG BOYS UNDER 16
0.1/ 100
METRIC RATING
264th/ 347
METRIC RANK
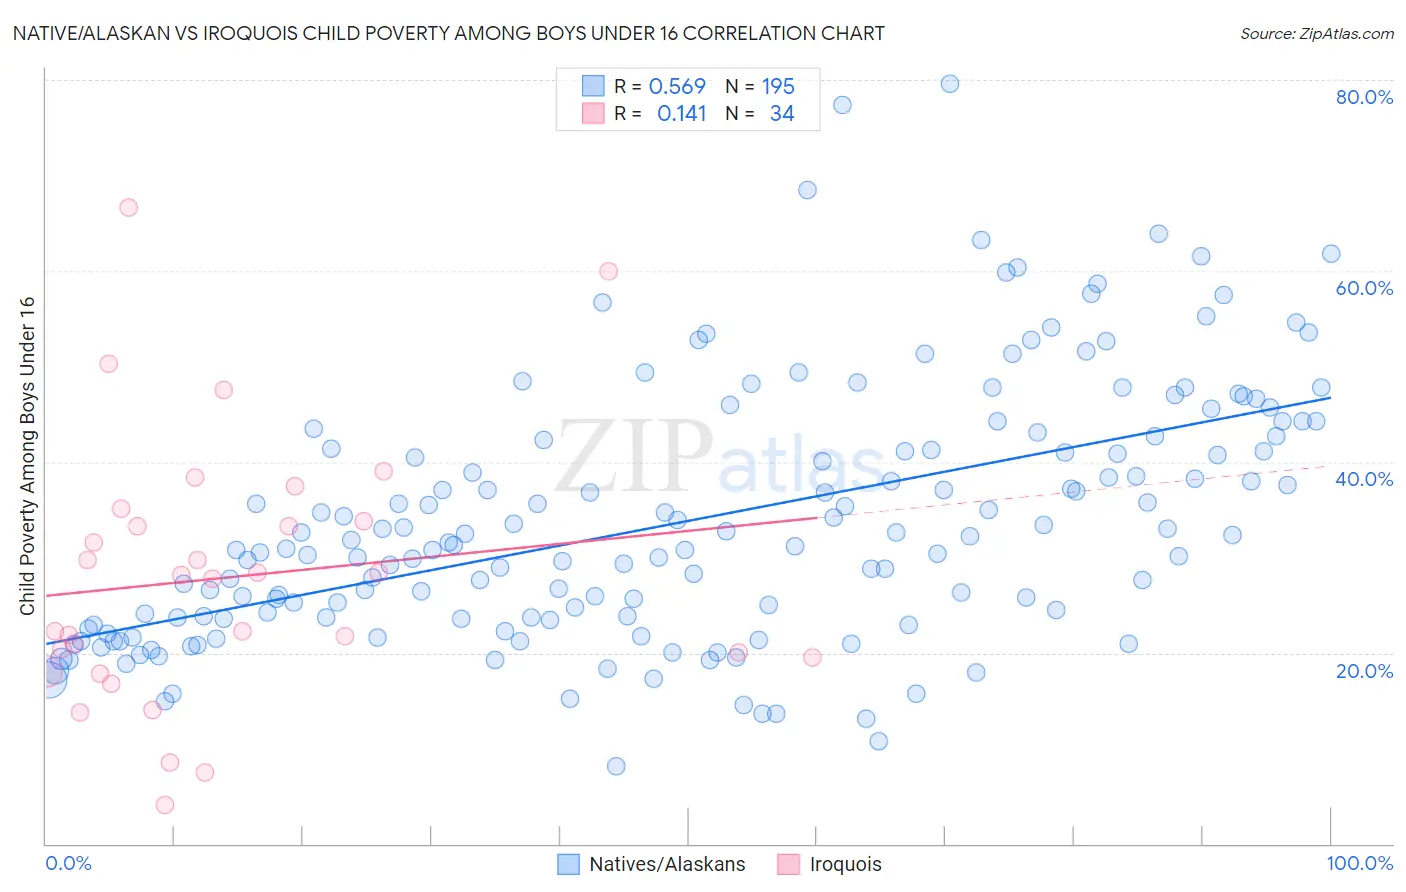
Native/Alaskan vs Iroquois Child Poverty Among Boys Under 16 Correlation Chart
The statistical analysis conducted on geographies consisting of 502,623,262 people shows a substantial positive correlation between the proportion of Natives/Alaskans and poverty level among boys under the age of 16 in the United States with a correlation coefficient (R) of 0.569 and weighted average of 24.0%. Similarly, the statistical analysis conducted on geographies consisting of 205,755,154 people shows a poor positive correlation between the proportion of Iroquois and poverty level among boys under the age of 16 in the United States with a correlation coefficient (R) of 0.141 and weighted average of 19.6%, a difference of 22.4%.
Child Poverty Among Boys Under 16 Correlation Summary
| Measurement | Native/Alaskan | Iroquois |
| Minimum | 8.2% | 4.1% |
| Maximum | 79.6% | 66.7% |
| Range | 71.4% | 62.6% |
| Mean | 33.8% | 27.9% |
| Median | 31.3% | 27.9% |
| Interquartile 25% (IQ1) | 23.6% | 19.5% |
| Interquartile 75% (IQ3) | 42.3% | 33.7% |
| Interquartile Range (IQR) | 18.7% | 14.3% |
| Standard Deviation (Sample) | 13.3% | 13.9% |
| Standard Deviation (Population) | 13.2% | 13.7% |
Similar Demographics by Child Poverty Among Boys Under 16
Demographics Similar to Natives/Alaskans by Child Poverty Among Boys Under 16
In terms of child poverty among boys under 16, the demographic groups most similar to Natives/Alaskans are Colville (24.1%, a difference of 0.58%), Dominican (24.2%, a difference of 0.92%), Immigrants from Dominican Republic (24.3%, a difference of 1.5%), Pueblo (23.5%, a difference of 1.9%), and Apache (24.5%, a difference of 2.2%).
| Demographics | Rating | Rank | Child Poverty Among Boys Under 16 |
| Immigrants | Dominica | 0.0 /100 | #322 | Tragic 22.2% |
| Hondurans | 0.0 /100 | #323 | Tragic 22.3% |
| Immigrants | Congo | 0.0 /100 | #324 | Tragic 22.4% |
| Central American Indians | 0.0 /100 | #325 | Tragic 22.5% |
| Paiute | 0.0 /100 | #326 | Tragic 22.8% |
| Immigrants | Honduras | 0.0 /100 | #327 | Tragic 22.8% |
| Pueblo | 0.0 /100 | #328 | Tragic 23.5% |
| Natives/Alaskans | 0.0 /100 | #329 | Tragic 24.0% |
| Colville | 0.0 /100 | #330 | Tragic 24.1% |
| Dominicans | 0.0 /100 | #331 | Tragic 24.2% |
| Immigrants | Dominican Republic | 0.0 /100 | #332 | Tragic 24.3% |
| Apache | 0.0 /100 | #333 | Tragic 24.5% |
| Blacks/African Americans | 0.0 /100 | #334 | Tragic 24.5% |
| Yup'ik | 0.0 /100 | #335 | Tragic 24.7% |
| Sioux | 0.0 /100 | #336 | Tragic 25.3% |
Demographics Similar to Iroquois by Child Poverty Among Boys Under 16
In terms of child poverty among boys under 16, the demographic groups most similar to Iroquois are Guyanese (19.6%, a difference of 0.090%), Immigrants from El Salvador (19.6%, a difference of 0.14%), Vietnamese (19.6%, a difference of 0.15%), Ottawa (19.5%, a difference of 0.22%), and Spanish American Indian (19.6%, a difference of 0.26%).
| Demographics | Rating | Rank | Child Poverty Among Boys Under 16 |
| Mexican American Indians | 0.2 /100 | #257 | Tragic 19.4% |
| Potawatomi | 0.2 /100 | #258 | Tragic 19.4% |
| Spanish Americans | 0.2 /100 | #259 | Tragic 19.4% |
| Shoshone | 0.2 /100 | #260 | Tragic 19.4% |
| Immigrants | Ghana | 0.2 /100 | #261 | Tragic 19.4% |
| Immigrants | Guyana | 0.1 /100 | #262 | Tragic 19.5% |
| Ottawa | 0.1 /100 | #263 | Tragic 19.5% |
| Iroquois | 0.1 /100 | #264 | Tragic 19.6% |
| Guyanese | 0.1 /100 | #265 | Tragic 19.6% |
| Immigrants | El Salvador | 0.1 /100 | #266 | Tragic 19.6% |
| Vietnamese | 0.1 /100 | #267 | Tragic 19.6% |
| Spanish American Indians | 0.1 /100 | #268 | Tragic 19.6% |
| Immigrants | Cabo Verde | 0.1 /100 | #269 | Tragic 19.7% |
| Cherokee | 0.1 /100 | #270 | Tragic 19.7% |
| Chickasaw | 0.1 /100 | #271 | Tragic 19.8% |