Native/Alaskan vs Latvian Child Poverty Among Boys Under 16
COMPARE
Native/Alaskan
Latvian
Child Poverty Among Boys Under 16
Child Poverty Among Boys Under 16 Comparison
Natives/Alaskans
Latvians
24.0%
CHILD POVERTY AMONG BOYS UNDER 16
0.0/ 100
METRIC RATING
329th/ 347
METRIC RANK
13.4%
CHILD POVERTY AMONG BOYS UNDER 16
99.9/ 100
METRIC RATING
23rd/ 347
METRIC RANK
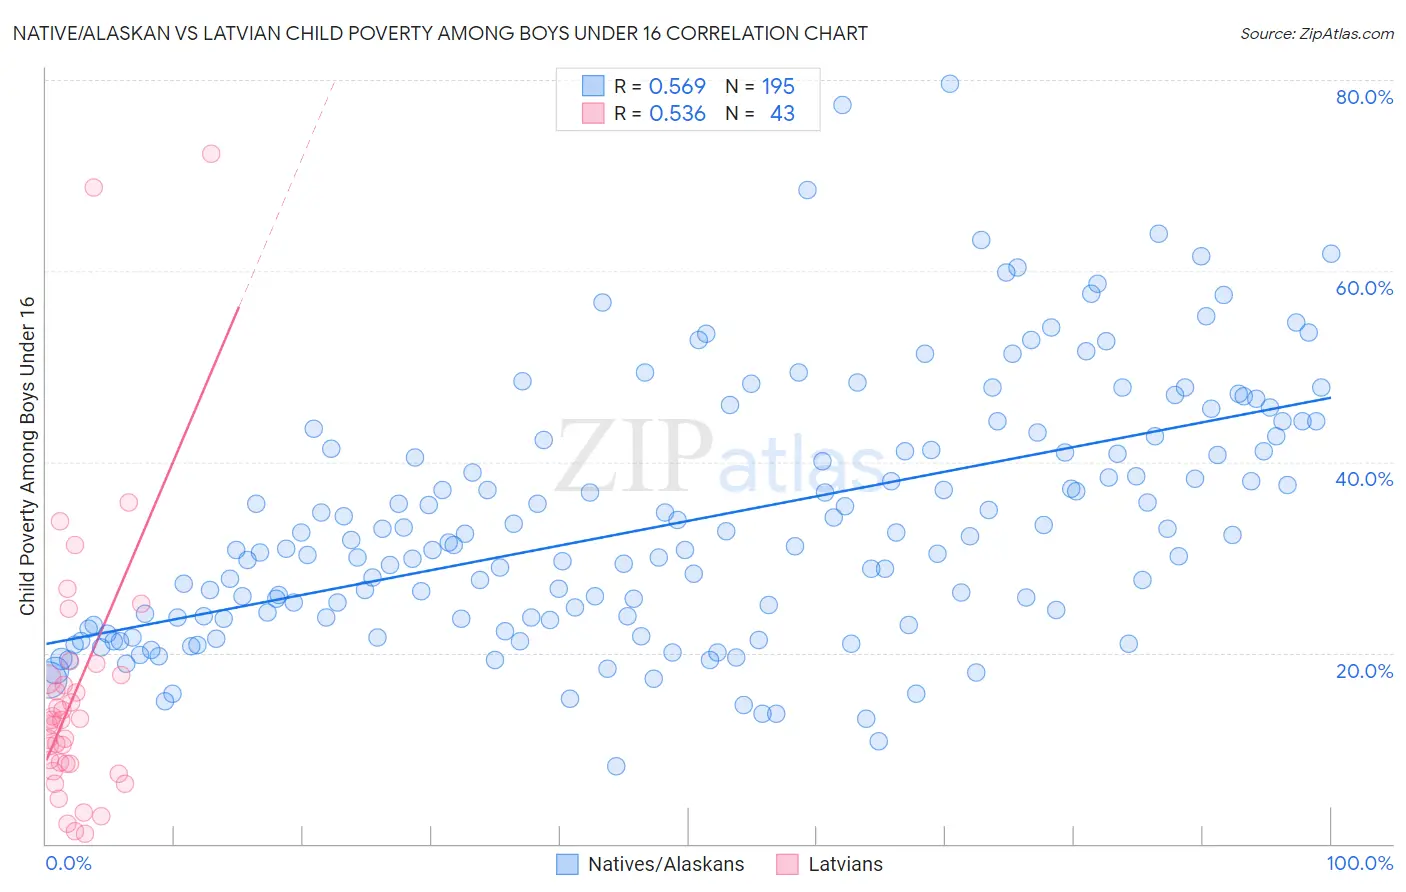
Native/Alaskan vs Latvian Child Poverty Among Boys Under 16 Correlation Chart
The statistical analysis conducted on geographies consisting of 502,623,262 people shows a substantial positive correlation between the proportion of Natives/Alaskans and poverty level among boys under the age of 16 in the United States with a correlation coefficient (R) of 0.569 and weighted average of 24.0%. Similarly, the statistical analysis conducted on geographies consisting of 217,672,016 people shows a substantial positive correlation between the proportion of Latvians and poverty level among boys under the age of 16 in the United States with a correlation coefficient (R) of 0.536 and weighted average of 13.4%, a difference of 79.2%.
Child Poverty Among Boys Under 16 Correlation Summary
| Measurement | Native/Alaskan | Latvian |
| Minimum | 8.2% | 1.1% |
| Maximum | 79.6% | 72.3% |
| Range | 71.4% | 71.3% |
| Mean | 33.8% | 16.0% |
| Median | 31.3% | 12.9% |
| Interquartile 25% (IQ1) | 23.6% | 8.4% |
| Interquartile 75% (IQ3) | 42.3% | 17.6% |
| Interquartile Range (IQR) | 18.7% | 9.2% |
| Standard Deviation (Sample) | 13.3% | 14.7% |
| Standard Deviation (Population) | 13.2% | 14.5% |
Similar Demographics by Child Poverty Among Boys Under 16
Demographics Similar to Natives/Alaskans by Child Poverty Among Boys Under 16
In terms of child poverty among boys under 16, the demographic groups most similar to Natives/Alaskans are Colville (24.1%, a difference of 0.58%), Dominican (24.2%, a difference of 0.92%), Immigrants from Dominican Republic (24.3%, a difference of 1.5%), Pueblo (23.5%, a difference of 1.9%), and Apache (24.5%, a difference of 2.2%).
| Demographics | Rating | Rank | Child Poverty Among Boys Under 16 |
| Immigrants | Dominica | 0.0 /100 | #322 | Tragic 22.2% |
| Hondurans | 0.0 /100 | #323 | Tragic 22.3% |
| Immigrants | Congo | 0.0 /100 | #324 | Tragic 22.4% |
| Central American Indians | 0.0 /100 | #325 | Tragic 22.5% |
| Paiute | 0.0 /100 | #326 | Tragic 22.8% |
| Immigrants | Honduras | 0.0 /100 | #327 | Tragic 22.8% |
| Pueblo | 0.0 /100 | #328 | Tragic 23.5% |
| Natives/Alaskans | 0.0 /100 | #329 | Tragic 24.0% |
| Colville | 0.0 /100 | #330 | Tragic 24.1% |
| Dominicans | 0.0 /100 | #331 | Tragic 24.2% |
| Immigrants | Dominican Republic | 0.0 /100 | #332 | Tragic 24.3% |
| Apache | 0.0 /100 | #333 | Tragic 24.5% |
| Blacks/African Americans | 0.0 /100 | #334 | Tragic 24.5% |
| Yup'ik | 0.0 /100 | #335 | Tragic 24.7% |
| Sioux | 0.0 /100 | #336 | Tragic 25.3% |
Demographics Similar to Latvians by Child Poverty Among Boys Under 16
In terms of child poverty among boys under 16, the demographic groups most similar to Latvians are Tongan (13.4%, a difference of 0.080%), Immigrants from Eastern Asia (13.3%, a difference of 0.16%), Indian (Asian) (13.3%, a difference of 0.76%), Bolivian (13.3%, a difference of 0.80%), and Immigrants from Lithuania (13.5%, a difference of 0.84%).
| Demographics | Rating | Rank | Child Poverty Among Boys Under 16 |
| Maltese | 99.9 /100 | #16 | Exceptional 13.2% |
| Norwegians | 99.9 /100 | #17 | Exceptional 13.2% |
| Bulgarians | 99.9 /100 | #18 | Exceptional 13.3% |
| Bolivians | 99.9 /100 | #19 | Exceptional 13.3% |
| Indians (Asian) | 99.9 /100 | #20 | Exceptional 13.3% |
| Immigrants | Eastern Asia | 99.9 /100 | #21 | Exceptional 13.3% |
| Tongans | 99.9 /100 | #22 | Exceptional 13.4% |
| Latvians | 99.9 /100 | #23 | Exceptional 13.4% |
| Immigrants | Lithuania | 99.8 /100 | #24 | Exceptional 13.5% |
| Okinawans | 99.8 /100 | #25 | Exceptional 13.5% |
| Immigrants | Bolivia | 99.8 /100 | #26 | Exceptional 13.5% |
| Asians | 99.8 /100 | #27 | Exceptional 13.5% |
| Eastern Europeans | 99.8 /100 | #28 | Exceptional 13.5% |
| Cypriots | 99.8 /100 | #29 | Exceptional 13.6% |
| Swedes | 99.8 /100 | #30 | Exceptional 13.6% |