Native/Alaskan vs Cheyenne Child Poverty Among Boys Under 16
COMPARE
Native/Alaskan
Cheyenne
Child Poverty Among Boys Under 16
Child Poverty Among Boys Under 16 Comparison
Natives/Alaskans
Cheyenne
24.0%
CHILD POVERTY AMONG BOYS UNDER 16
0.0/ 100
METRIC RATING
329th/ 347
METRIC RANK
25.8%
CHILD POVERTY AMONG BOYS UNDER 16
0.0/ 100
METRIC RATING
337th/ 347
METRIC RANK
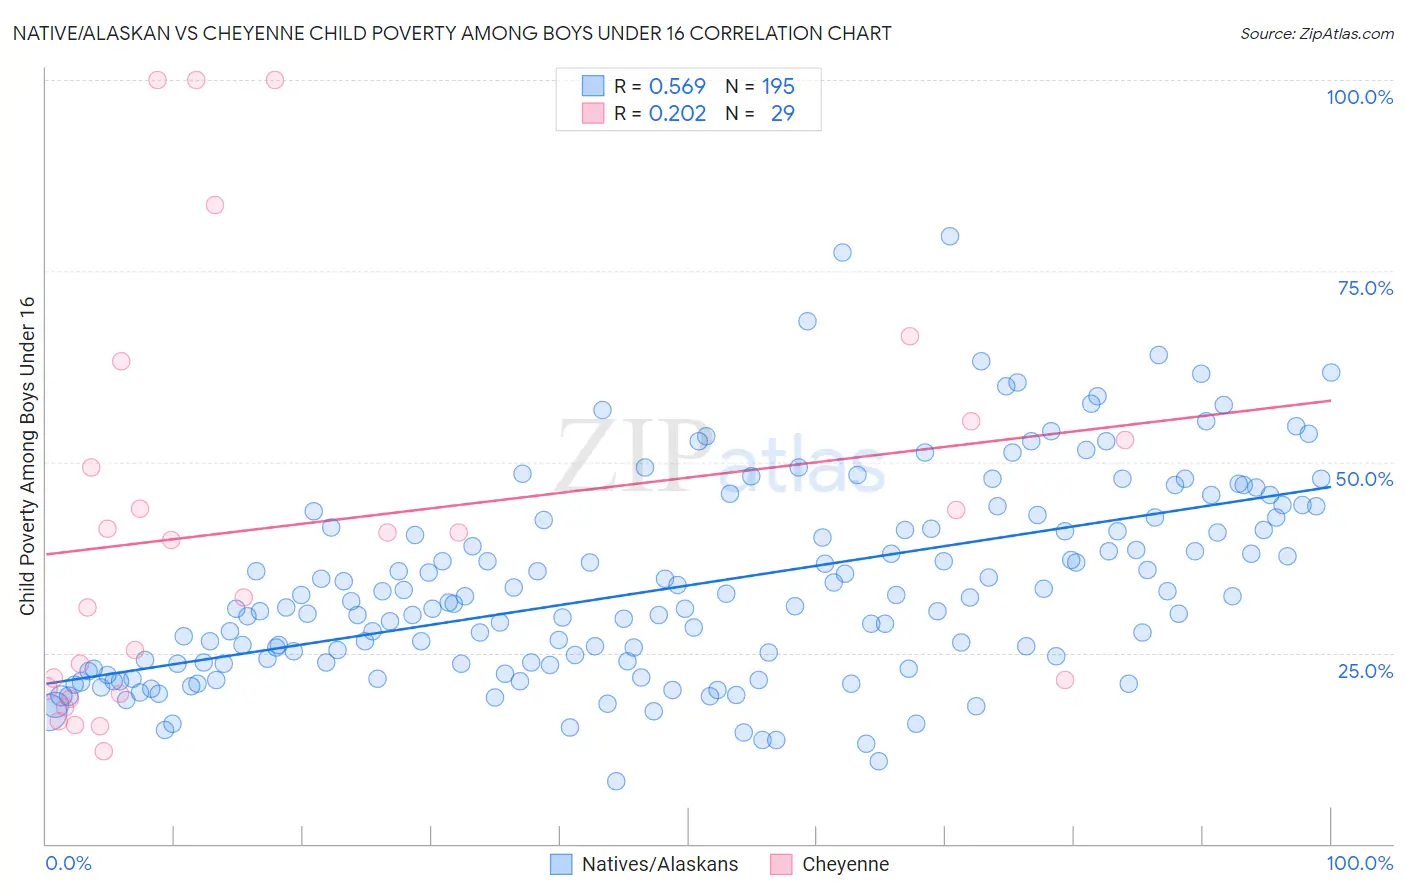
Native/Alaskan vs Cheyenne Child Poverty Among Boys Under 16 Correlation Chart
The statistical analysis conducted on geographies consisting of 502,623,262 people shows a substantial positive correlation between the proportion of Natives/Alaskans and poverty level among boys under the age of 16 in the United States with a correlation coefficient (R) of 0.569 and weighted average of 24.0%. Similarly, the statistical analysis conducted on geographies consisting of 80,373,873 people shows a weak positive correlation between the proportion of Cheyenne and poverty level among boys under the age of 16 in the United States with a correlation coefficient (R) of 0.202 and weighted average of 25.8%, a difference of 7.7%.
Child Poverty Among Boys Under 16 Correlation Summary
| Measurement | Native/Alaskan | Cheyenne |
| Minimum | 8.2% | 12.2% |
| Maximum | 79.6% | 100.0% |
| Range | 71.4% | 87.8% |
| Mean | 33.8% | 41.8% |
| Median | 31.3% | 39.8% |
| Interquartile 25% (IQ1) | 23.6% | 20.0% |
| Interquartile 75% (IQ3) | 42.3% | 54.1% |
| Interquartile Range (IQR) | 18.7% | 34.1% |
| Standard Deviation (Sample) | 13.3% | 26.7% |
| Standard Deviation (Population) | 13.2% | 26.2% |
Demographics Similar to Natives/Alaskans and Cheyenne by Child Poverty Among Boys Under 16
In terms of child poverty among boys under 16, the demographic groups most similar to Natives/Alaskans are Colville (24.1%, a difference of 0.58%), Dominican (24.2%, a difference of 0.92%), Immigrants from Dominican Republic (24.3%, a difference of 1.5%), Pueblo (23.5%, a difference of 1.9%), and Apache (24.5%, a difference of 2.2%). Similarly, the demographic groups most similar to Cheyenne are Hopi (25.9%, a difference of 0.51%), Houma (26.2%, a difference of 1.5%), Crow (26.3%, a difference of 1.7%), Sioux (25.3%, a difference of 2.0%), and Yup'ik (24.7%, a difference of 4.4%).
| Demographics | Rating | Rank | Child Poverty Among Boys Under 16 |
| Hondurans | 0.0 /100 | #323 | Tragic 22.3% |
| Immigrants | Congo | 0.0 /100 | #324 | Tragic 22.4% |
| Central American Indians | 0.0 /100 | #325 | Tragic 22.5% |
| Paiute | 0.0 /100 | #326 | Tragic 22.8% |
| Immigrants | Honduras | 0.0 /100 | #327 | Tragic 22.8% |
| Pueblo | 0.0 /100 | #328 | Tragic 23.5% |
| Natives/Alaskans | 0.0 /100 | #329 | Tragic 24.0% |
| Colville | 0.0 /100 | #330 | Tragic 24.1% |
| Dominicans | 0.0 /100 | #331 | Tragic 24.2% |
| Immigrants | Dominican Republic | 0.0 /100 | #332 | Tragic 24.3% |
| Apache | 0.0 /100 | #333 | Tragic 24.5% |
| Blacks/African Americans | 0.0 /100 | #334 | Tragic 24.5% |
| Yup'ik | 0.0 /100 | #335 | Tragic 24.7% |
| Sioux | 0.0 /100 | #336 | Tragic 25.3% |
| Cheyenne | 0.0 /100 | #337 | Tragic 25.8% |
| Hopi | 0.0 /100 | #338 | Tragic 25.9% |
| Houma | 0.0 /100 | #339 | Tragic 26.2% |
| Crow | 0.0 /100 | #340 | Tragic 26.3% |
| Immigrants | Yemen | 0.0 /100 | #341 | Tragic 28.9% |
| Pima | 0.0 /100 | #342 | Tragic 29.7% |
| Navajo | 0.0 /100 | #343 | Tragic 30.3% |