Immigrants from Croatia vs Iroquois Child Poverty Among Boys Under 16
COMPARE
Immigrants from Croatia
Iroquois
Child Poverty Among Boys Under 16
Child Poverty Among Boys Under 16 Comparison
Immigrants from Croatia
Iroquois
14.7%
CHILD POVERTY AMONG BOYS UNDER 16
97.9/ 100
METRIC RATING
76th/ 347
METRIC RANK
19.6%
CHILD POVERTY AMONG BOYS UNDER 16
0.1/ 100
METRIC RATING
264th/ 347
METRIC RANK
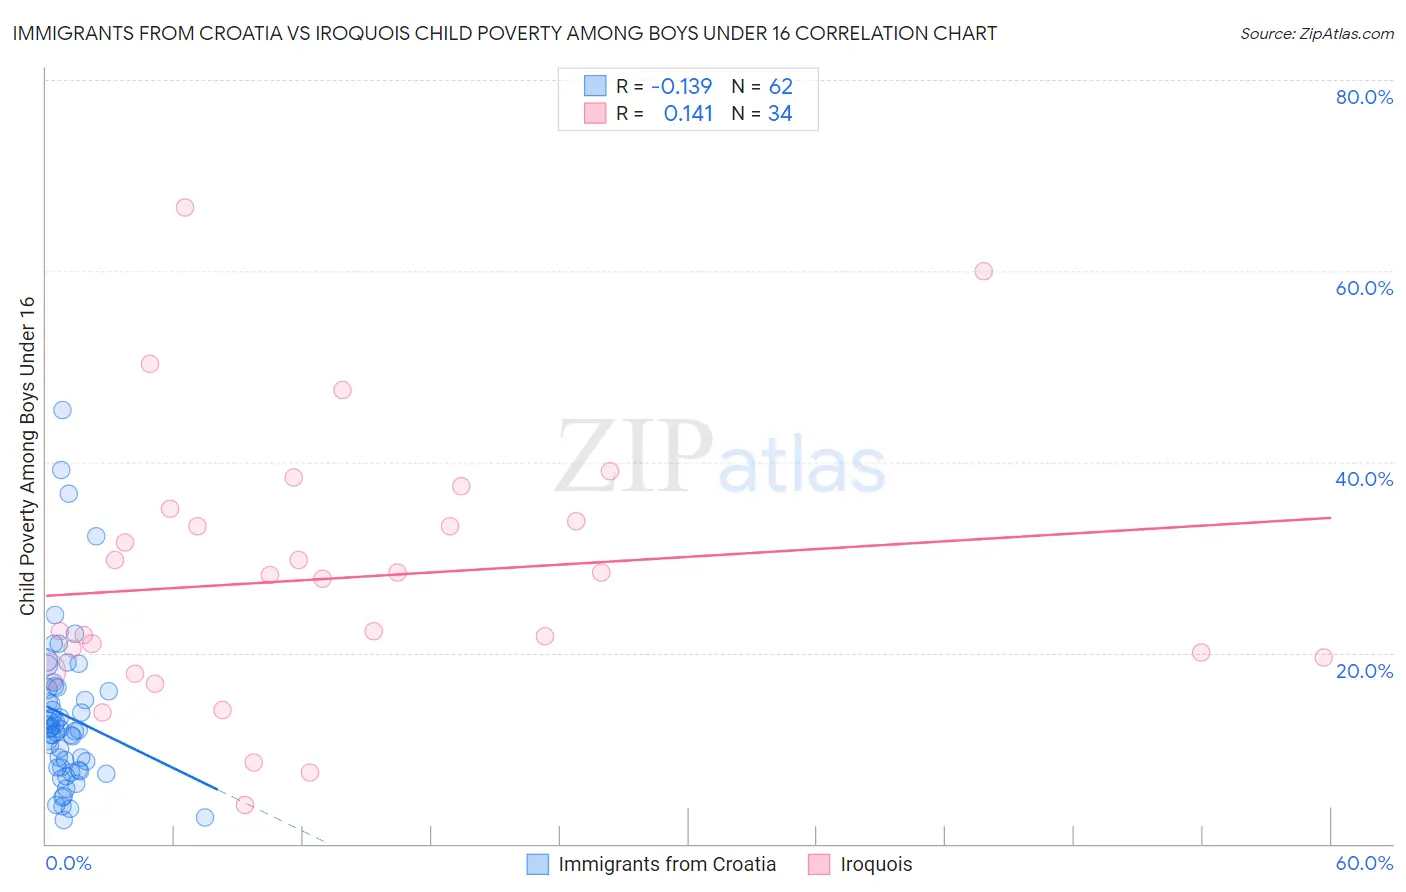
Immigrants from Croatia vs Iroquois Child Poverty Among Boys Under 16 Correlation Chart
The statistical analysis conducted on geographies consisting of 131,435,038 people shows a poor negative correlation between the proportion of Immigrants from Croatia and poverty level among boys under the age of 16 in the United States with a correlation coefficient (R) of -0.139 and weighted average of 14.7%. Similarly, the statistical analysis conducted on geographies consisting of 205,755,154 people shows a poor positive correlation between the proportion of Iroquois and poverty level among boys under the age of 16 in the United States with a correlation coefficient (R) of 0.141 and weighted average of 19.6%, a difference of 33.4%.
Child Poverty Among Boys Under 16 Correlation Summary
| Measurement | Immigrants from Croatia | Iroquois |
| Minimum | 2.5% | 4.1% |
| Maximum | 45.5% | 66.7% |
| Range | 42.9% | 62.6% |
| Mean | 13.4% | 27.9% |
| Median | 11.9% | 27.9% |
| Interquartile 25% (IQ1) | 7.9% | 19.5% |
| Interquartile 75% (IQ3) | 16.3% | 33.7% |
| Interquartile Range (IQR) | 8.3% | 14.3% |
| Standard Deviation (Sample) | 8.3% | 13.9% |
| Standard Deviation (Population) | 8.3% | 13.7% |
Similar Demographics by Child Poverty Among Boys Under 16
Demographics Similar to Immigrants from Croatia by Child Poverty Among Boys Under 16
In terms of child poverty among boys under 16, the demographic groups most similar to Immigrants from Croatia are Immigrants from Poland (14.7%, a difference of 0.050%), Macedonian (14.7%, a difference of 0.060%), Egyptian (14.7%, a difference of 0.11%), Australian (14.7%, a difference of 0.13%), and Immigrants from Turkey (14.6%, a difference of 0.17%).
| Demographics | Rating | Rank | Child Poverty Among Boys Under 16 |
| Immigrants | Austria | 98.4 /100 | #69 | Exceptional 14.5% |
| Europeans | 98.4 /100 | #70 | Exceptional 14.5% |
| Immigrants | Netherlands | 98.1 /100 | #71 | Exceptional 14.6% |
| Immigrants | Latvia | 98.1 /100 | #72 | Exceptional 14.6% |
| Immigrants | Turkey | 98.0 /100 | #73 | Exceptional 14.6% |
| Australians | 98.0 /100 | #74 | Exceptional 14.7% |
| Immigrants | Poland | 97.9 /100 | #75 | Exceptional 14.7% |
| Immigrants | Croatia | 97.9 /100 | #76 | Exceptional 14.7% |
| Macedonians | 97.9 /100 | #77 | Exceptional 14.7% |
| Egyptians | 97.8 /100 | #78 | Exceptional 14.7% |
| Immigrants | Eastern Europe | 97.8 /100 | #79 | Exceptional 14.7% |
| Immigrants | Russia | 97.7 /100 | #80 | Exceptional 14.7% |
| Immigrants | Canada | 97.6 /100 | #81 | Exceptional 14.7% |
| Ukrainians | 97.6 /100 | #82 | Exceptional 14.7% |
| Immigrants | South Africa | 97.4 /100 | #83 | Exceptional 14.8% |
Demographics Similar to Iroquois by Child Poverty Among Boys Under 16
In terms of child poverty among boys under 16, the demographic groups most similar to Iroquois are Guyanese (19.6%, a difference of 0.090%), Immigrants from El Salvador (19.6%, a difference of 0.14%), Vietnamese (19.6%, a difference of 0.15%), Ottawa (19.5%, a difference of 0.22%), and Spanish American Indian (19.6%, a difference of 0.26%).
| Demographics | Rating | Rank | Child Poverty Among Boys Under 16 |
| Mexican American Indians | 0.2 /100 | #257 | Tragic 19.4% |
| Potawatomi | 0.2 /100 | #258 | Tragic 19.4% |
| Spanish Americans | 0.2 /100 | #259 | Tragic 19.4% |
| Shoshone | 0.2 /100 | #260 | Tragic 19.4% |
| Immigrants | Ghana | 0.2 /100 | #261 | Tragic 19.4% |
| Immigrants | Guyana | 0.1 /100 | #262 | Tragic 19.5% |
| Ottawa | 0.1 /100 | #263 | Tragic 19.5% |
| Iroquois | 0.1 /100 | #264 | Tragic 19.6% |
| Guyanese | 0.1 /100 | #265 | Tragic 19.6% |
| Immigrants | El Salvador | 0.1 /100 | #266 | Tragic 19.6% |
| Vietnamese | 0.1 /100 | #267 | Tragic 19.6% |
| Spanish American Indians | 0.1 /100 | #268 | Tragic 19.6% |
| Immigrants | Cabo Verde | 0.1 /100 | #269 | Tragic 19.7% |
| Cherokee | 0.1 /100 | #270 | Tragic 19.7% |
| Chickasaw | 0.1 /100 | #271 | Tragic 19.8% |