Native/Alaskan vs Austrian Child Poverty Among Boys Under 16
COMPARE
Native/Alaskan
Austrian
Child Poverty Among Boys Under 16
Child Poverty Among Boys Under 16 Comparison
Natives/Alaskans
Austrians
24.0%
CHILD POVERTY AMONG BOYS UNDER 16
0.0/ 100
METRIC RATING
329th/ 347
METRIC RANK
14.8%
CHILD POVERTY AMONG BOYS UNDER 16
97.1/ 100
METRIC RATING
90th/ 347
METRIC RANK
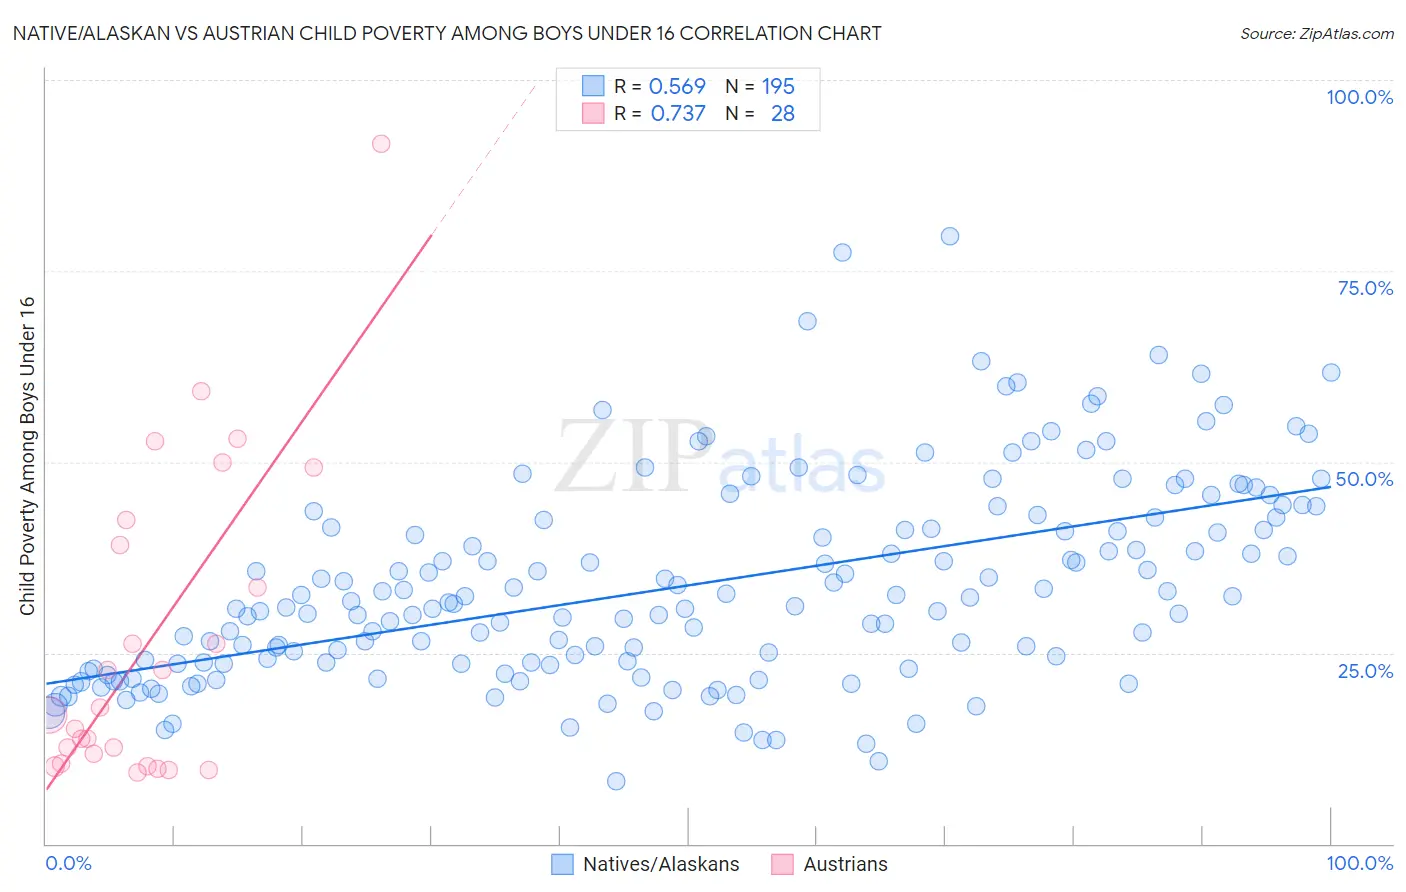
Native/Alaskan vs Austrian Child Poverty Among Boys Under 16 Correlation Chart
The statistical analysis conducted on geographies consisting of 502,623,262 people shows a substantial positive correlation between the proportion of Natives/Alaskans and poverty level among boys under the age of 16 in the United States with a correlation coefficient (R) of 0.569 and weighted average of 24.0%. Similarly, the statistical analysis conducted on geographies consisting of 440,747,470 people shows a strong positive correlation between the proportion of Austrians and poverty level among boys under the age of 16 in the United States with a correlation coefficient (R) of 0.737 and weighted average of 14.8%, a difference of 61.6%.
Child Poverty Among Boys Under 16 Correlation Summary
| Measurement | Native/Alaskan | Austrian |
| Minimum | 8.2% | 9.4% |
| Maximum | 79.6% | 91.7% |
| Range | 71.4% | 82.3% |
| Mean | 33.8% | 26.9% |
| Median | 31.3% | 17.4% |
| Interquartile 25% (IQ1) | 23.6% | 11.1% |
| Interquartile 75% (IQ3) | 42.3% | 40.8% |
| Interquartile Range (IQR) | 18.7% | 29.6% |
| Standard Deviation (Sample) | 13.3% | 20.6% |
| Standard Deviation (Population) | 13.2% | 20.2% |
Similar Demographics by Child Poverty Among Boys Under 16
Demographics Similar to Natives/Alaskans by Child Poverty Among Boys Under 16
In terms of child poverty among boys under 16, the demographic groups most similar to Natives/Alaskans are Colville (24.1%, a difference of 0.58%), Dominican (24.2%, a difference of 0.92%), Immigrants from Dominican Republic (24.3%, a difference of 1.5%), Pueblo (23.5%, a difference of 1.9%), and Apache (24.5%, a difference of 2.2%).
| Demographics | Rating | Rank | Child Poverty Among Boys Under 16 |
| Immigrants | Dominica | 0.0 /100 | #322 | Tragic 22.2% |
| Hondurans | 0.0 /100 | #323 | Tragic 22.3% |
| Immigrants | Congo | 0.0 /100 | #324 | Tragic 22.4% |
| Central American Indians | 0.0 /100 | #325 | Tragic 22.5% |
| Paiute | 0.0 /100 | #326 | Tragic 22.8% |
| Immigrants | Honduras | 0.0 /100 | #327 | Tragic 22.8% |
| Pueblo | 0.0 /100 | #328 | Tragic 23.5% |
| Natives/Alaskans | 0.0 /100 | #329 | Tragic 24.0% |
| Colville | 0.0 /100 | #330 | Tragic 24.1% |
| Dominicans | 0.0 /100 | #331 | Tragic 24.2% |
| Immigrants | Dominican Republic | 0.0 /100 | #332 | Tragic 24.3% |
| Apache | 0.0 /100 | #333 | Tragic 24.5% |
| Blacks/African Americans | 0.0 /100 | #334 | Tragic 24.5% |
| Yup'ik | 0.0 /100 | #335 | Tragic 24.7% |
| Sioux | 0.0 /100 | #336 | Tragic 25.3% |
Demographics Similar to Austrians by Child Poverty Among Boys Under 16
In terms of child poverty among boys under 16, the demographic groups most similar to Austrians are Immigrants from Argentina (14.8%, a difference of 0.010%), Immigrants from North America (14.8%, a difference of 0.090%), Northern European (14.8%, a difference of 0.10%), German (14.8%, a difference of 0.15%), and Taiwanese (14.8%, a difference of 0.22%).
| Demographics | Rating | Rank | Child Poverty Among Boys Under 16 |
| Immigrants | South Africa | 97.4 /100 | #83 | Exceptional 14.8% |
| Swiss | 97.3 /100 | #84 | Exceptional 14.8% |
| Taiwanese | 97.3 /100 | #85 | Exceptional 14.8% |
| Germans | 97.2 /100 | #86 | Exceptional 14.8% |
| Northern Europeans | 97.2 /100 | #87 | Exceptional 14.8% |
| Immigrants | North America | 97.1 /100 | #88 | Exceptional 14.8% |
| Immigrants | Argentina | 97.1 /100 | #89 | Exceptional 14.8% |
| Austrians | 97.1 /100 | #90 | Exceptional 14.8% |
| Paraguayans | 96.8 /100 | #91 | Exceptional 14.9% |
| Argentineans | 96.7 /100 | #92 | Exceptional 14.9% |
| Sri Lankans | 96.7 /100 | #93 | Exceptional 14.9% |
| Immigrants | Italy | 96.7 /100 | #94 | Exceptional 14.9% |
| Finns | 96.5 /100 | #95 | Exceptional 14.9% |
| Immigrants | North Macedonia | 96.3 /100 | #96 | Exceptional 14.9% |
| Immigrants | Egypt | 96.2 /100 | #97 | Exceptional 14.9% |