Native/Alaskan vs Nepalese Child Poverty Among Boys Under 16
COMPARE
Native/Alaskan
Nepalese
Child Poverty Among Boys Under 16
Child Poverty Among Boys Under 16 Comparison
Natives/Alaskans
Nepalese
24.0%
CHILD POVERTY AMONG BOYS UNDER 16
0.0/ 100
METRIC RATING
329th/ 347
METRIC RANK
18.0%
CHILD POVERTY AMONG BOYS UNDER 16
3.2/ 100
METRIC RATING
224th/ 347
METRIC RANK
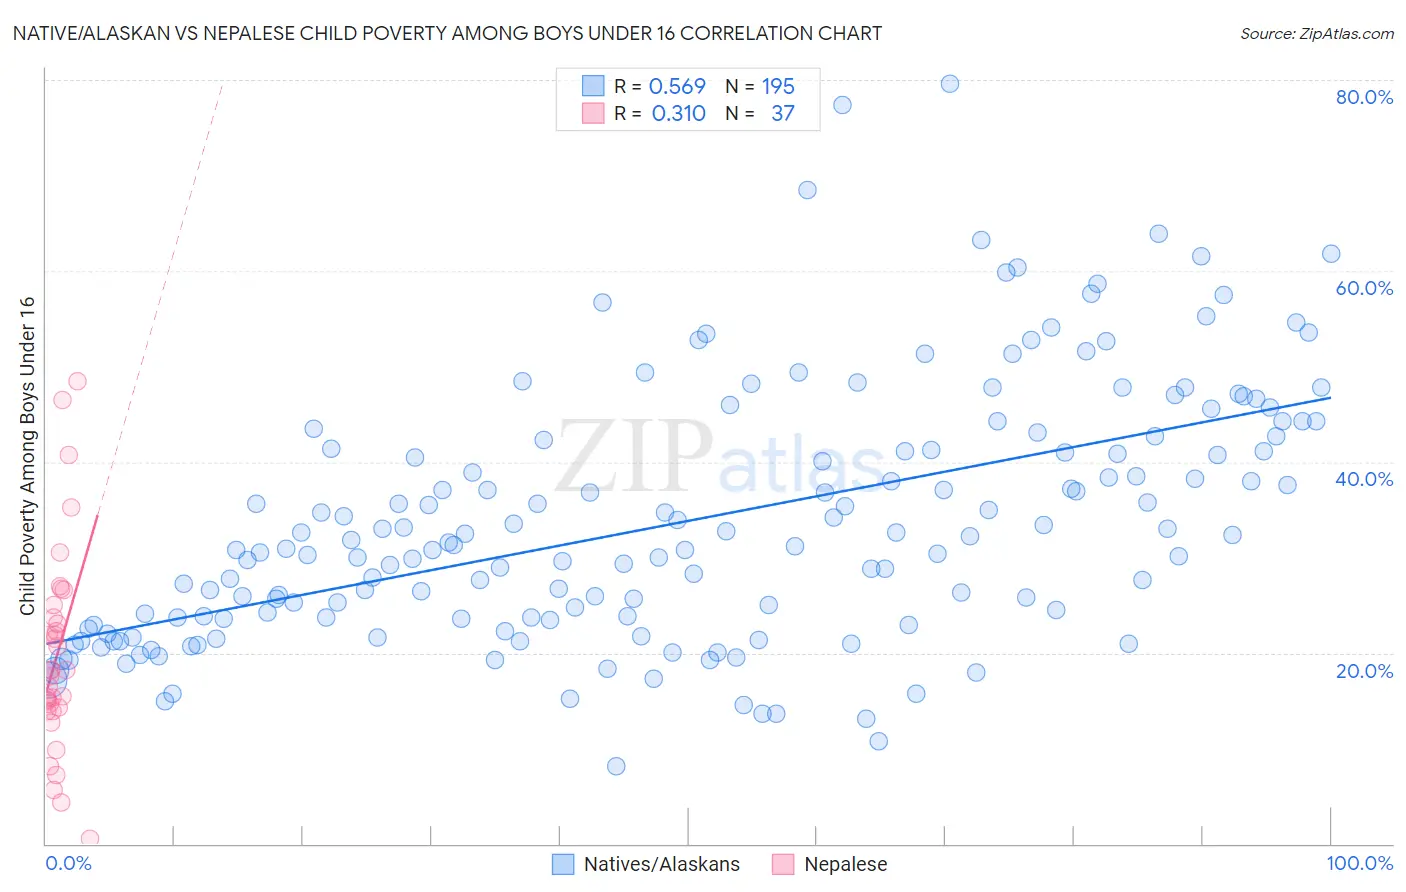
Native/Alaskan vs Nepalese Child Poverty Among Boys Under 16 Correlation Chart
The statistical analysis conducted on geographies consisting of 502,623,262 people shows a substantial positive correlation between the proportion of Natives/Alaskans and poverty level among boys under the age of 16 in the United States with a correlation coefficient (R) of 0.569 and weighted average of 24.0%. Similarly, the statistical analysis conducted on geographies consisting of 24,516,782 people shows a mild positive correlation between the proportion of Nepalese and poverty level among boys under the age of 16 in the United States with a correlation coefficient (R) of 0.310 and weighted average of 18.0%, a difference of 33.1%.
Child Poverty Among Boys Under 16 Correlation Summary
| Measurement | Native/Alaskan | Nepalese |
| Minimum | 8.2% | 0.48% |
| Maximum | 79.6% | 48.5% |
| Range | 71.4% | 48.0% |
| Mean | 33.8% | 19.8% |
| Median | 31.3% | 18.2% |
| Interquartile 25% (IQ1) | 23.6% | 14.1% |
| Interquartile 75% (IQ3) | 42.3% | 24.4% |
| Interquartile Range (IQR) | 18.7% | 10.3% |
| Standard Deviation (Sample) | 13.3% | 10.6% |
| Standard Deviation (Population) | 13.2% | 10.5% |
Similar Demographics by Child Poverty Among Boys Under 16
Demographics Similar to Natives/Alaskans by Child Poverty Among Boys Under 16
In terms of child poverty among boys under 16, the demographic groups most similar to Natives/Alaskans are Colville (24.1%, a difference of 0.58%), Dominican (24.2%, a difference of 0.92%), Immigrants from Dominican Republic (24.3%, a difference of 1.5%), Pueblo (23.5%, a difference of 1.9%), and Apache (24.5%, a difference of 2.2%).
| Demographics | Rating | Rank | Child Poverty Among Boys Under 16 |
| Immigrants | Dominica | 0.0 /100 | #322 | Tragic 22.2% |
| Hondurans | 0.0 /100 | #323 | Tragic 22.3% |
| Immigrants | Congo | 0.0 /100 | #324 | Tragic 22.4% |
| Central American Indians | 0.0 /100 | #325 | Tragic 22.5% |
| Paiute | 0.0 /100 | #326 | Tragic 22.8% |
| Immigrants | Honduras | 0.0 /100 | #327 | Tragic 22.8% |
| Pueblo | 0.0 /100 | #328 | Tragic 23.5% |
| Natives/Alaskans | 0.0 /100 | #329 | Tragic 24.0% |
| Colville | 0.0 /100 | #330 | Tragic 24.1% |
| Dominicans | 0.0 /100 | #331 | Tragic 24.2% |
| Immigrants | Dominican Republic | 0.0 /100 | #332 | Tragic 24.3% |
| Apache | 0.0 /100 | #333 | Tragic 24.5% |
| Blacks/African Americans | 0.0 /100 | #334 | Tragic 24.5% |
| Yup'ik | 0.0 /100 | #335 | Tragic 24.7% |
| Sioux | 0.0 /100 | #336 | Tragic 25.3% |
Demographics Similar to Nepalese by Child Poverty Among Boys Under 16
In terms of child poverty among boys under 16, the demographic groups most similar to Nepalese are Inupiat (18.1%, a difference of 0.41%), Cuban (17.9%, a difference of 0.47%), Pennsylvania German (17.9%, a difference of 0.56%), Immigrants from Africa (18.1%, a difference of 0.57%), and Bermudan (18.1%, a difference of 0.67%).
| Demographics | Rating | Rank | Child Poverty Among Boys Under 16 |
| Japanese | 5.5 /100 | #217 | Tragic 17.7% |
| Iraqis | 5.5 /100 | #218 | Tragic 17.7% |
| Sierra Leoneans | 5.3 /100 | #219 | Tragic 17.8% |
| Immigrants | Cambodia | 5.1 /100 | #220 | Tragic 17.8% |
| Immigrants | Panama | 4.3 /100 | #221 | Tragic 17.9% |
| Pennsylvania Germans | 3.9 /100 | #222 | Tragic 17.9% |
| Cubans | 3.8 /100 | #223 | Tragic 17.9% |
| Nepalese | 3.2 /100 | #224 | Tragic 18.0% |
| Inupiat | 2.7 /100 | #225 | Tragic 18.1% |
| Immigrants | Africa | 2.6 /100 | #226 | Tragic 18.1% |
| Bermudans | 2.5 /100 | #227 | Tragic 18.1% |
| Immigrants | Nonimmigrants | 2.2 /100 | #228 | Tragic 18.2% |
| Immigrants | Micronesia | 1.8 /100 | #229 | Tragic 18.3% |
| Fijians | 1.8 /100 | #230 | Tragic 18.3% |
| Nicaraguans | 1.4 /100 | #231 | Tragic 18.4% |