Immigrants from Western Asia vs Immigrants from Israel Single Father Poverty
COMPARE
Immigrants from Western Asia
Immigrants from Israel
Single Father Poverty
Single Father Poverty Comparison
Immigrants from Western Asia
Immigrants from Israel
16.0%
SINGLE FATHER POVERTY
80.7/ 100
METRIC RATING
145th/ 347
METRIC RANK
16.1%
SINGLE FATHER POVERTY
72.0/ 100
METRIC RATING
153rd/ 347
METRIC RANK
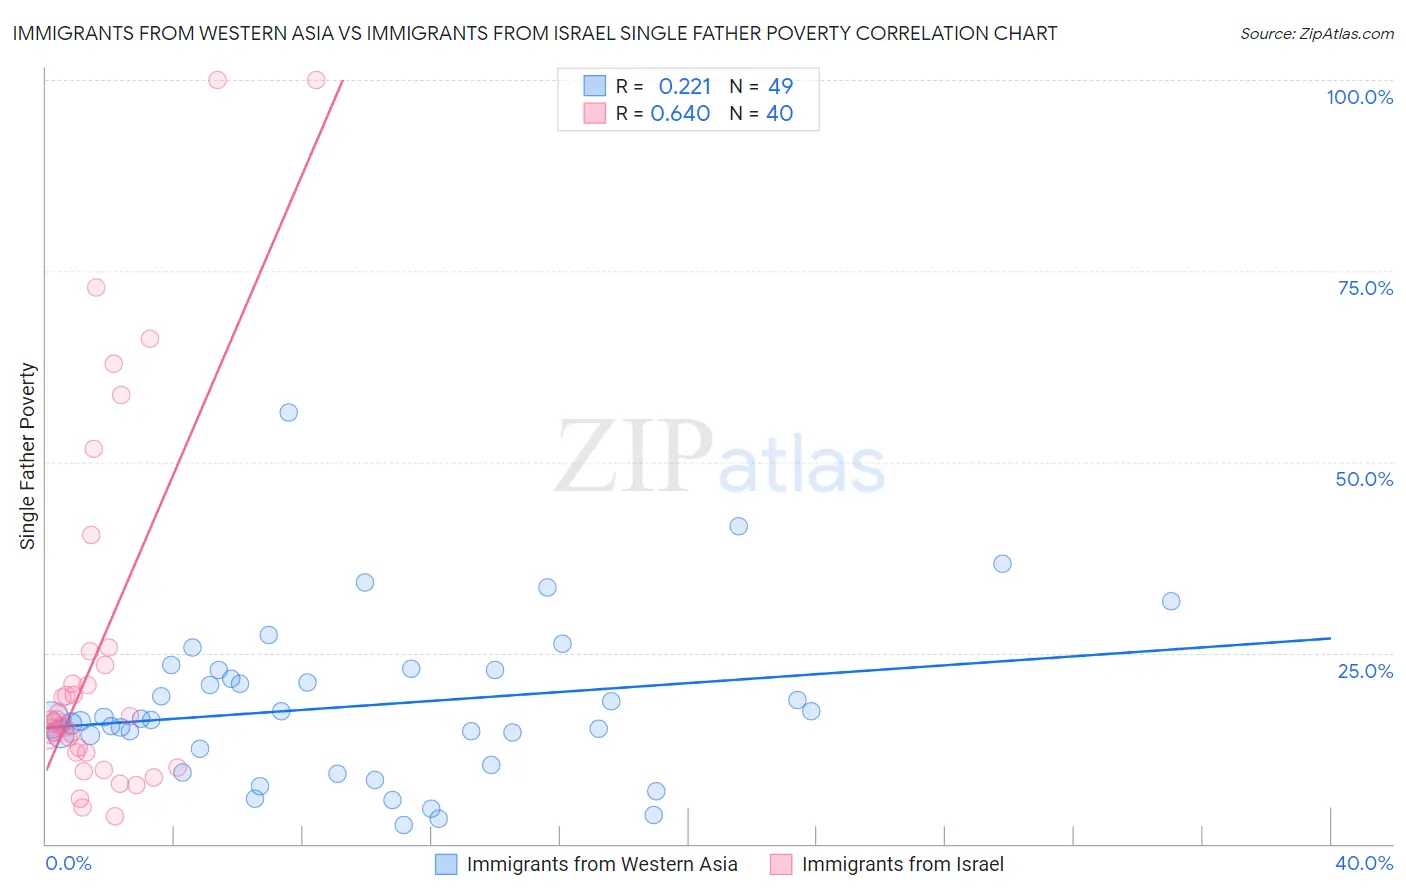
Immigrants from Western Asia vs Immigrants from Israel Single Father Poverty Correlation Chart
The statistical analysis conducted on geographies consisting of 315,849,822 people shows a weak positive correlation between the proportion of Immigrants from Western Asia and poverty level among single fathers in the United States with a correlation coefficient (R) of 0.221 and weighted average of 16.0%. Similarly, the statistical analysis conducted on geographies consisting of 172,515,206 people shows a significant positive correlation between the proportion of Immigrants from Israel and poverty level among single fathers in the United States with a correlation coefficient (R) of 0.640 and weighted average of 16.1%, a difference of 0.55%.
Single Father Poverty Correlation Summary
| Measurement | Immigrants from Western Asia | Immigrants from Israel |
| Minimum | 2.4% | 3.6% |
| Maximum | 56.5% | 100.0% |
| Range | 54.1% | 96.4% |
| Mean | 18.1% | 25.4% |
| Median | 16.3% | 16.0% |
| Interquartile 25% (IQ1) | 11.4% | 11.9% |
| Interquartile 75% (IQ3) | 22.7% | 24.3% |
| Interquartile Range (IQR) | 11.3% | 12.4% |
| Standard Deviation (Sample) | 10.5% | 24.4% |
| Standard Deviation (Population) | 10.3% | 24.1% |
Demographics Similar to Immigrants from Western Asia and Immigrants from Israel by Single Father Poverty
In terms of single father poverty, the demographic groups most similar to Immigrants from Western Asia are Immigrants from Kuwait (16.0%, a difference of 0.050%), Immigrants from Hungary (16.1%, a difference of 0.16%), Immigrants from Central America (16.0%, a difference of 0.18%), Liberian (16.0%, a difference of 0.20%), and Immigrants from Mexico (16.0%, a difference of 0.20%). Similarly, the demographic groups most similar to Immigrants from Israel are Immigrants from Zimbabwe (16.1%, a difference of 0.0%), Immigrants from France (16.1%, a difference of 0.060%), Mexican (16.1%, a difference of 0.10%), Jordanian (16.1%, a difference of 0.13%), and South African (16.1%, a difference of 0.18%).
| Demographics | Rating | Rank | Single Father Poverty |
| South Americans | 85.9 /100 | #139 | Excellent 16.0% |
| Immigrants | Netherlands | 85.3 /100 | #140 | Excellent 16.0% |
| Liberians | 83.3 /100 | #141 | Excellent 16.0% |
| Immigrants | Mexico | 83.3 /100 | #142 | Excellent 16.0% |
| Immigrants | Central America | 83.1 /100 | #143 | Excellent 16.0% |
| Immigrants | Kuwait | 81.4 /100 | #144 | Excellent 16.0% |
| Immigrants | Western Asia | 80.7 /100 | #145 | Excellent 16.0% |
| Immigrants | Hungary | 78.3 /100 | #146 | Good 16.1% |
| Colombians | 77.1 /100 | #147 | Good 16.1% |
| Nigerians | 76.8 /100 | #148 | Good 16.1% |
| South Africans | 75.1 /100 | #149 | Good 16.1% |
| Jordanians | 74.2 /100 | #150 | Good 16.1% |
| Immigrants | France | 73.1 /100 | #151 | Good 16.1% |
| Immigrants | Zimbabwe | 72.1 /100 | #152 | Good 16.1% |
| Immigrants | Israel | 72.0 /100 | #153 | Good 16.1% |
| Mexicans | 70.1 /100 | #154 | Good 16.1% |
| Immigrants | Nicaragua | 67.8 /100 | #155 | Good 16.2% |
| Immigrants | Jordan | 66.0 /100 | #156 | Good 16.2% |
| Immigrants | Czechoslovakia | 62.8 /100 | #157 | Good 16.2% |
| Portuguese | 62.3 /100 | #158 | Good 16.2% |
| Belizeans | 59.9 /100 | #159 | Average 16.2% |