Guamanian/Chamorro vs Immigrants from Israel Single Father Poverty
COMPARE
Guamanian/Chamorro
Immigrants from Israel
Single Father Poverty
Single Father Poverty Comparison
Guamanians/Chamorros
Immigrants from Israel
15.1%
SINGLE FATHER POVERTY
99.9/ 100
METRIC RATING
59th/ 347
METRIC RANK
16.1%
SINGLE FATHER POVERTY
72.0/ 100
METRIC RATING
153rd/ 347
METRIC RANK
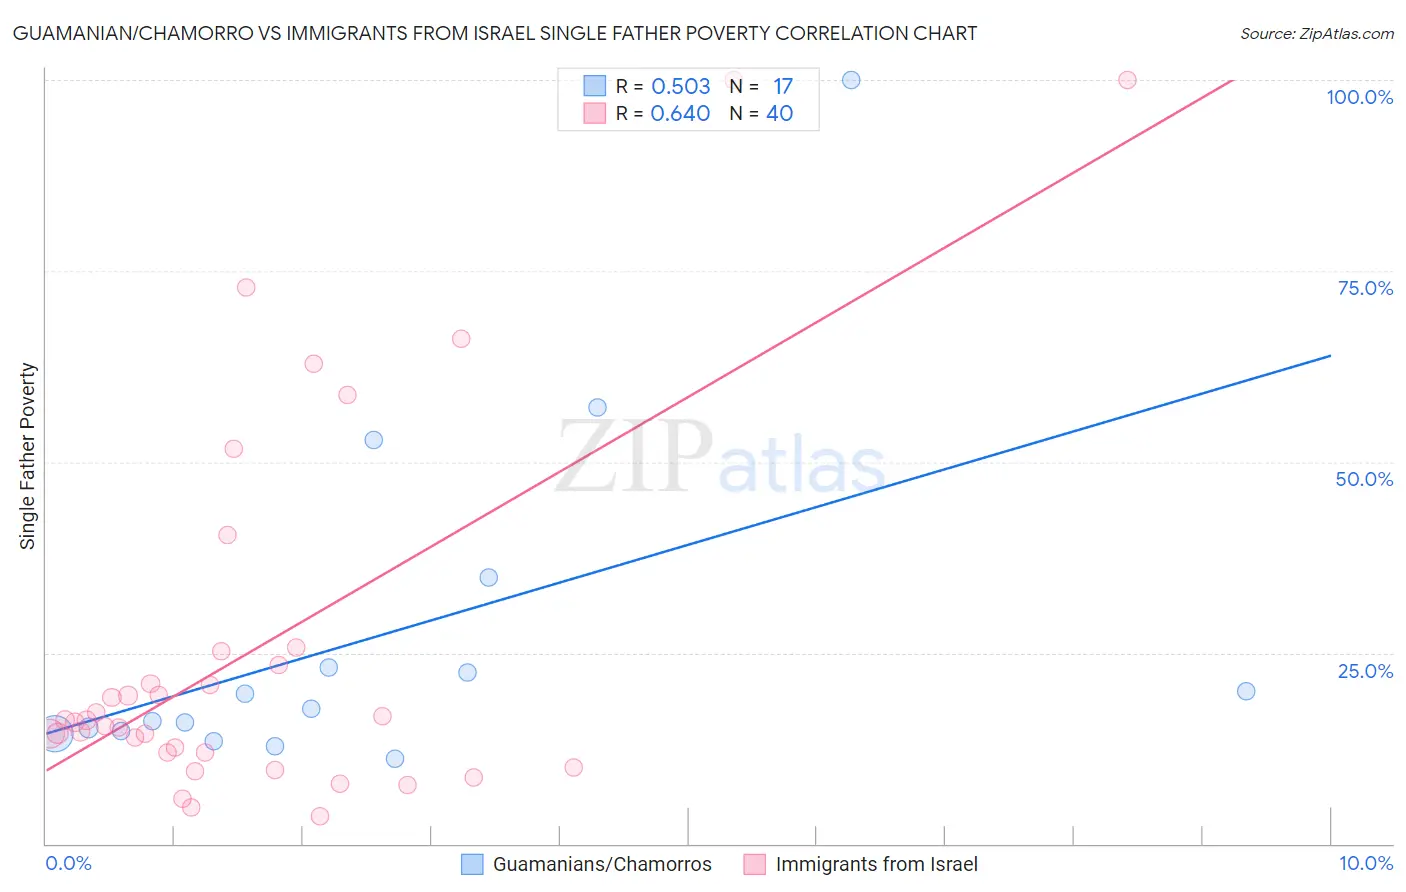
Guamanian/Chamorro vs Immigrants from Israel Single Father Poverty Correlation Chart
The statistical analysis conducted on geographies consisting of 191,371,634 people shows a substantial positive correlation between the proportion of Guamanians/Chamorros and poverty level among single fathers in the United States with a correlation coefficient (R) of 0.503 and weighted average of 15.1%. Similarly, the statistical analysis conducted on geographies consisting of 172,515,206 people shows a significant positive correlation between the proportion of Immigrants from Israel and poverty level among single fathers in the United States with a correlation coefficient (R) of 0.640 and weighted average of 16.1%, a difference of 6.8%.
Single Father Poverty Correlation Summary
| Measurement | Guamanian/Chamorro | Immigrants from Israel |
| Minimum | 11.2% | 3.6% |
| Maximum | 100.0% | 100.0% |
| Range | 88.8% | 96.4% |
| Mean | 27.1% | 25.4% |
| Median | 17.6% | 16.0% |
| Interquartile 25% (IQ1) | 14.6% | 11.9% |
| Interquartile 75% (IQ3) | 29.0% | 24.3% |
| Interquartile Range (IQR) | 14.4% | 12.4% |
| Standard Deviation (Sample) | 23.1% | 24.4% |
| Standard Deviation (Population) | 22.4% | 24.1% |
Similar Demographics by Single Father Poverty
Demographics Similar to Guamanians/Chamorros by Single Father Poverty
In terms of single father poverty, the demographic groups most similar to Guamanians/Chamorros are Hawaiian (15.1%, a difference of 0.10%), Laotian (15.1%, a difference of 0.15%), Immigrants from Laos (15.1%, a difference of 0.24%), Puget Sound Salish (15.2%, a difference of 0.40%), and Immigrants from Bosnia and Herzegovina (15.2%, a difference of 0.45%).
| Demographics | Rating | Rank | Single Father Poverty |
| Immigrants | El Salvador | 99.9 /100 | #52 | Exceptional 15.0% |
| Immigrants | Kenya | 99.9 /100 | #53 | Exceptional 15.0% |
| Immigrants | Uzbekistan | 99.9 /100 | #54 | Exceptional 15.0% |
| Immigrants | Bulgaria | 99.9 /100 | #55 | Exceptional 15.0% |
| Immigrants | Laos | 99.9 /100 | #56 | Exceptional 15.1% |
| Laotians | 99.9 /100 | #57 | Exceptional 15.1% |
| Hawaiians | 99.9 /100 | #58 | Exceptional 15.1% |
| Guamanians/Chamorros | 99.9 /100 | #59 | Exceptional 15.1% |
| Puget Sound Salish | 99.8 /100 | #60 | Exceptional 15.2% |
| Immigrants | Bosnia and Herzegovina | 99.8 /100 | #61 | Exceptional 15.2% |
| Immigrants | Armenia | 99.8 /100 | #62 | Exceptional 15.2% |
| Immigrants | Sweden | 99.8 /100 | #63 | Exceptional 15.2% |
| Bangladeshis | 99.8 /100 | #64 | Exceptional 15.2% |
| Immigrants | Malaysia | 99.8 /100 | #65 | Exceptional 15.2% |
| Immigrants | Moldova | 99.8 /100 | #66 | Exceptional 15.2% |
Demographics Similar to Immigrants from Israel by Single Father Poverty
In terms of single father poverty, the demographic groups most similar to Immigrants from Israel are Immigrants from Zimbabwe (16.1%, a difference of 0.0%), Immigrants from France (16.1%, a difference of 0.060%), Mexican (16.1%, a difference of 0.10%), Jordanian (16.1%, a difference of 0.13%), and South African (16.1%, a difference of 0.18%).
| Demographics | Rating | Rank | Single Father Poverty |
| Immigrants | Hungary | 78.3 /100 | #146 | Good 16.1% |
| Colombians | 77.1 /100 | #147 | Good 16.1% |
| Nigerians | 76.8 /100 | #148 | Good 16.1% |
| South Africans | 75.1 /100 | #149 | Good 16.1% |
| Jordanians | 74.2 /100 | #150 | Good 16.1% |
| Immigrants | France | 73.1 /100 | #151 | Good 16.1% |
| Immigrants | Zimbabwe | 72.1 /100 | #152 | Good 16.1% |
| Immigrants | Israel | 72.0 /100 | #153 | Good 16.1% |
| Mexicans | 70.1 /100 | #154 | Good 16.1% |
| Immigrants | Nicaragua | 67.8 /100 | #155 | Good 16.2% |
| Immigrants | Jordan | 66.0 /100 | #156 | Good 16.2% |
| Immigrants | Czechoslovakia | 62.8 /100 | #157 | Good 16.2% |
| Portuguese | 62.3 /100 | #158 | Good 16.2% |
| Belizeans | 59.9 /100 | #159 | Average 16.2% |
| Immigrants | Sudan | 59.8 /100 | #160 | Average 16.2% |