Moroccan vs Delaware Unemployment Among Ages 45 to 54 years
COMPARE
Moroccan
Delaware
Unemployment Among Ages 45 to 54 years
Unemployment Among Ages 45 to 54 years Comparison
Moroccans
Delaware
4.8%
UNEMPLOYMENT AMONG AGES 45 TO 54 YEARS
0.3/ 100
METRIC RATING
253rd/ 347
METRIC RANK
4.8%
UNEMPLOYMENT AMONG AGES 45 TO 54 YEARS
1.3/ 100
METRIC RATING
241st/ 347
METRIC RANK
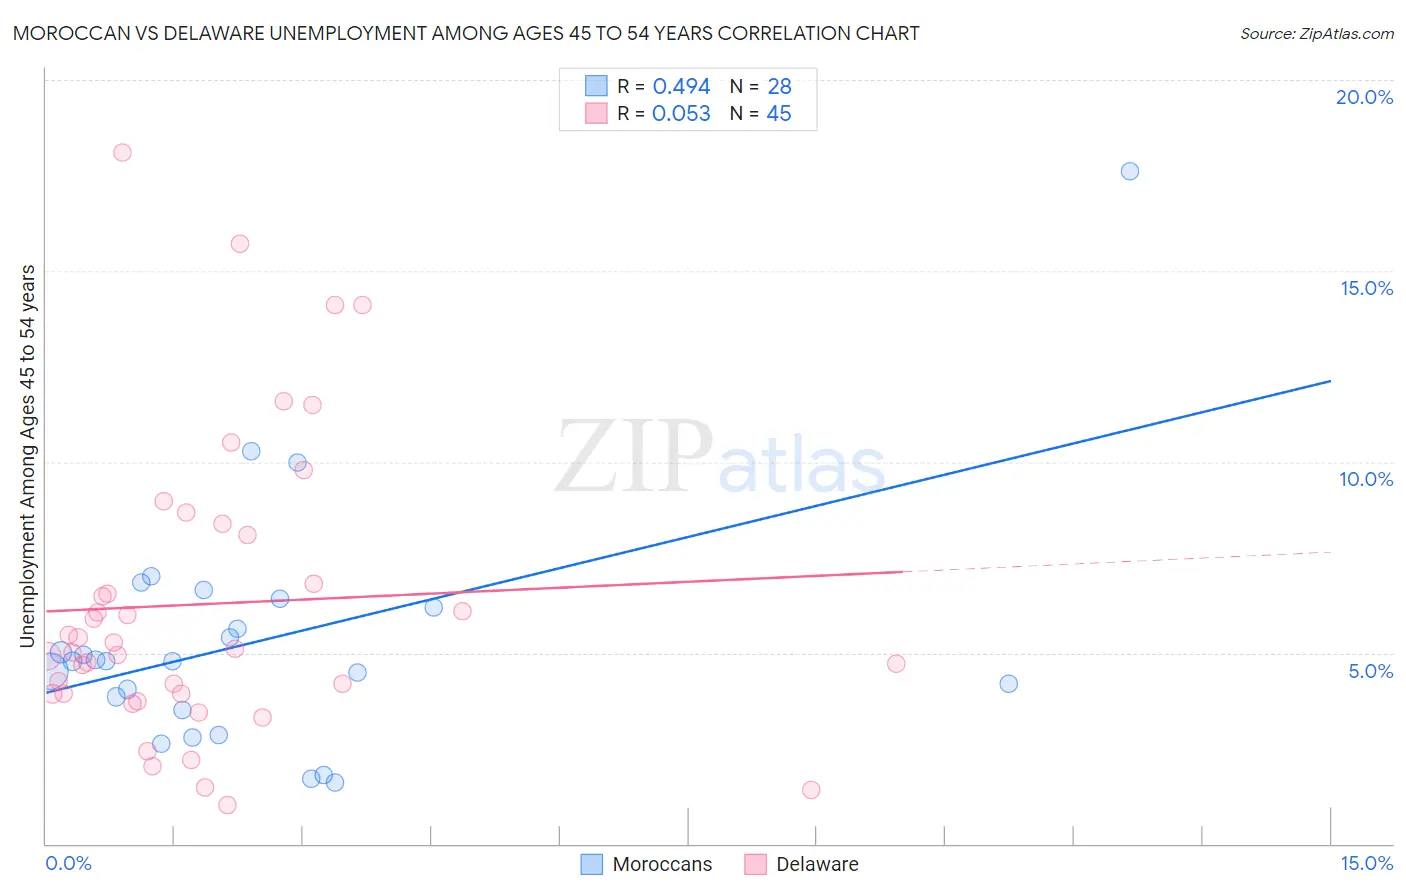
Moroccan vs Delaware Unemployment Among Ages 45 to 54 years Correlation Chart
The statistical analysis conducted on geographies consisting of 199,854,001 people shows a moderate positive correlation between the proportion of Moroccans and unemployment rate among population between the ages 45 and 54 in the United States with a correlation coefficient (R) of 0.494 and weighted average of 4.8%. Similarly, the statistical analysis conducted on geographies consisting of 95,085,648 people shows a slight positive correlation between the proportion of Delaware and unemployment rate among population between the ages 45 and 54 in the United States with a correlation coefficient (R) of 0.053 and weighted average of 4.8%, a difference of 1.6%.
Unemployment Among Ages 45 to 54 years Correlation Summary
| Measurement | Moroccan | Delaware |
| Minimum | 1.6% | 1.0% |
| Maximum | 17.6% | 18.1% |
| Range | 16.0% | 17.1% |
| Mean | 5.3% | 6.3% |
| Median | 4.8% | 5.1% |
| Interquartile 25% (IQ1) | 3.7% | 3.9% |
| Interquartile 75% (IQ3) | 6.3% | 8.2% |
| Interquartile Range (IQR) | 2.6% | 4.3% |
| Standard Deviation (Sample) | 3.2% | 3.9% |
| Standard Deviation (Population) | 3.1% | 3.8% |
Demographics Similar to Moroccans and Delaware by Unemployment Among Ages 45 to 54 years
In terms of unemployment among ages 45 to 54 years, the demographic groups most similar to Moroccans are Immigrants from Bahamas (4.8%, a difference of 0.17%), Immigrants from Lebanon (4.8%, a difference of 0.22%), Immigrants from El Salvador (4.8%, a difference of 0.35%), Honduran (4.8%, a difference of 0.41%), and Immigrants from Western Asia (4.8%, a difference of 0.43%). Similarly, the demographic groups most similar to Delaware are Central American (4.8%, a difference of 0.0%), Immigrants from Iraq (4.7%, a difference of 0.070%), Yaqui (4.7%, a difference of 0.10%), Spanish American (4.7%, a difference of 0.10%), and Portuguese (4.8%, a difference of 0.12%).
| Demographics | Rating | Rank | Unemployment Among Ages 45 to 54 years |
| Alsatians | 1.6 /100 | #237 | Tragic 4.7% |
| Yaqui | 1.4 /100 | #238 | Tragic 4.7% |
| Spanish Americans | 1.4 /100 | #239 | Tragic 4.7% |
| Immigrants | Iraq | 1.3 /100 | #240 | Tragic 4.7% |
| Delaware | 1.3 /100 | #241 | Tragic 4.8% |
| Central Americans | 1.3 /100 | #242 | Tragic 4.8% |
| Portuguese | 1.1 /100 | #243 | Tragic 4.8% |
| Seminole | 1.1 /100 | #244 | Tragic 4.8% |
| Immigrants | Albania | 0.9 /100 | #245 | Tragic 4.8% |
| Immigrants | Syria | 0.9 /100 | #246 | Tragic 4.8% |
| Israelis | 0.9 /100 | #247 | Tragic 4.8% |
| Immigrants | Liberia | 0.8 /100 | #248 | Tragic 4.8% |
| Immigrants | Honduras | 0.7 /100 | #249 | Tragic 4.8% |
| Salvadorans | 0.7 /100 | #250 | Tragic 4.8% |
| Hondurans | 0.4 /100 | #251 | Tragic 4.8% |
| Immigrants | Bahamas | 0.3 /100 | #252 | Tragic 4.8% |
| Moroccans | 0.3 /100 | #253 | Tragic 4.8% |
| Immigrants | Lebanon | 0.2 /100 | #254 | Tragic 4.8% |
| Immigrants | El Salvador | 0.2 /100 | #255 | Tragic 4.8% |
| Immigrants | Western Asia | 0.2 /100 | #256 | Tragic 4.8% |
| Immigrants | Western Africa | 0.2 /100 | #257 | Tragic 4.9% |