Immigrants from Congo vs Indonesian Single Father Poverty
COMPARE
Immigrants from Congo
Indonesian
Single Father Poverty
Single Father Poverty Comparison
Immigrants from Congo
Indonesians
15.4%
SINGLE FATHER POVERTY
99.4/ 100
METRIC RATING
81st/ 347
METRIC RANK
17.4%
SINGLE FATHER POVERTY
0.2/ 100
METRIC RATING
270th/ 347
METRIC RANK
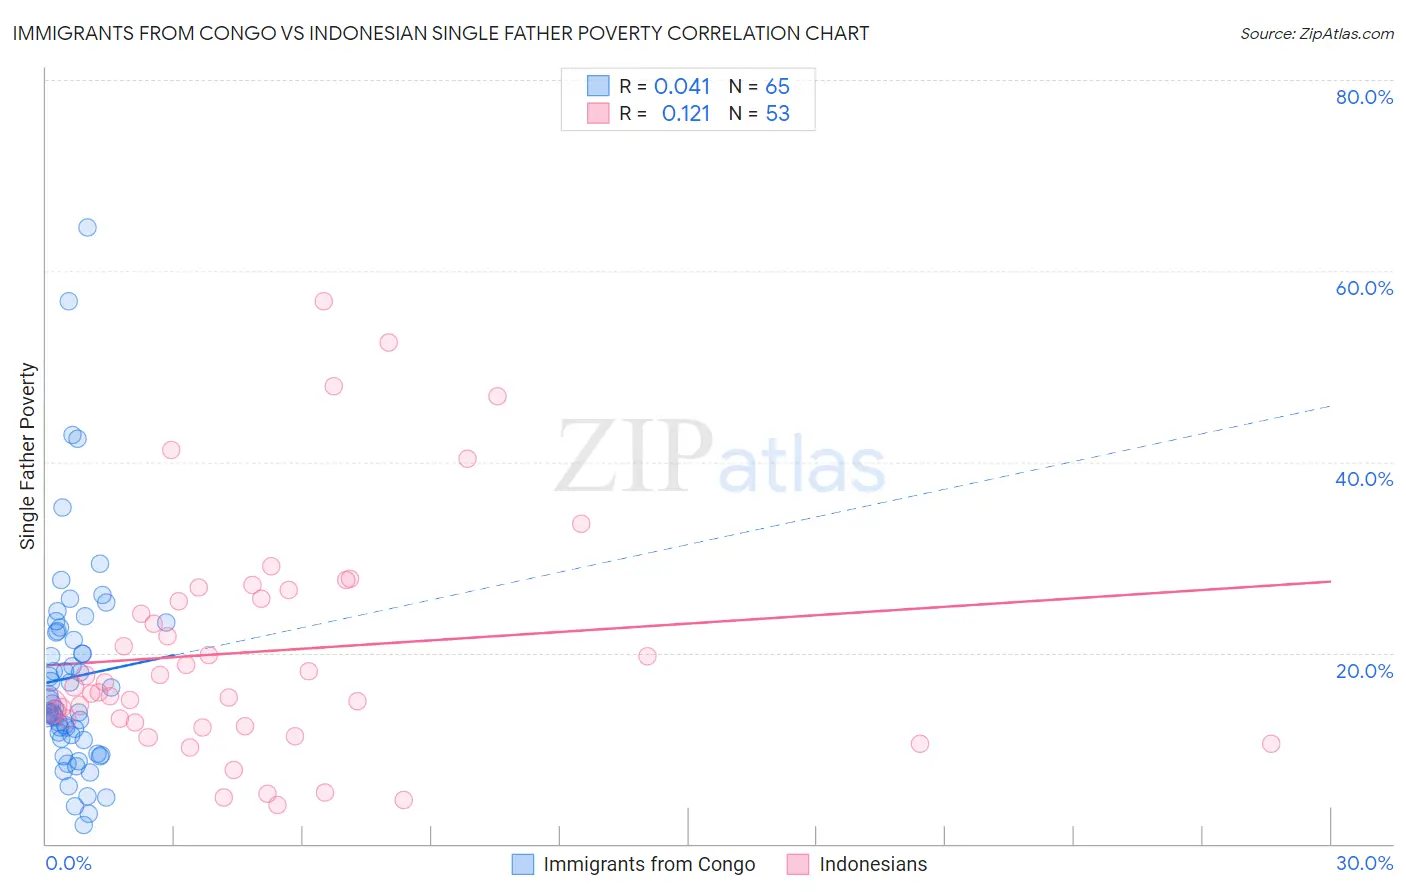
Immigrants from Congo vs Indonesian Single Father Poverty Correlation Chart
The statistical analysis conducted on geographies consisting of 86,642,680 people shows no correlation between the proportion of Immigrants from Congo and poverty level among single fathers in the United States with a correlation coefficient (R) of 0.041 and weighted average of 15.4%. Similarly, the statistical analysis conducted on geographies consisting of 143,522,675 people shows a poor positive correlation between the proportion of Indonesians and poverty level among single fathers in the United States with a correlation coefficient (R) of 0.121 and weighted average of 17.4%, a difference of 13.2%.
Single Father Poverty Correlation Summary
| Measurement | Immigrants from Congo | Indonesian |
| Minimum | 2.0% | 4.1% |
| Maximum | 64.6% | 56.8% |
| Range | 62.6% | 52.7% |
| Mean | 17.4% | 20.1% |
| Median | 14.1% | 16.5% |
| Interquartile 25% (IQ1) | 10.9% | 12.5% |
| Interquartile 75% (IQ3) | 22.2% | 26.1% |
| Interquartile Range (IQR) | 11.2% | 13.6% |
| Standard Deviation (Sample) | 11.4% | 12.2% |
| Standard Deviation (Population) | 11.3% | 12.1% |
Similar Demographics by Single Father Poverty
Demographics Similar to Immigrants from Congo by Single Father Poverty
In terms of single father poverty, the demographic groups most similar to Immigrants from Congo are Immigrants from Ukraine (15.4%, a difference of 0.010%), Armenian (15.4%, a difference of 0.020%), Chinese (15.4%, a difference of 0.10%), Peruvian (15.4%, a difference of 0.24%), and Immigrants from Northern Africa (15.3%, a difference of 0.25%).
| Demographics | Rating | Rank | Single Father Poverty |
| Maltese | 99.6 /100 | #74 | Exceptional 15.3% |
| Immigrants | Turkey | 99.5 /100 | #75 | Exceptional 15.3% |
| Immigrants | Japan | 99.5 /100 | #76 | Exceptional 15.3% |
| Immigrants | Peru | 99.5 /100 | #77 | Exceptional 15.3% |
| Tlingit-Haida | 99.5 /100 | #78 | Exceptional 15.3% |
| Immigrants | Northern Africa | 99.5 /100 | #79 | Exceptional 15.3% |
| Armenians | 99.4 /100 | #80 | Exceptional 15.4% |
| Immigrants | Congo | 99.4 /100 | #81 | Exceptional 15.4% |
| Immigrants | Ukraine | 99.4 /100 | #82 | Exceptional 15.4% |
| Chinese | 99.3 /100 | #83 | Exceptional 15.4% |
| Peruvians | 99.2 /100 | #84 | Exceptional 15.4% |
| Immigrants | Oceania | 99.1 /100 | #85 | Exceptional 15.4% |
| Immigrants | Russia | 99.0 /100 | #86 | Exceptional 15.5% |
| Brazilians | 99.0 /100 | #87 | Exceptional 15.5% |
| Burmese | 99.0 /100 | #88 | Exceptional 15.5% |
Demographics Similar to Indonesians by Single Father Poverty
In terms of single father poverty, the demographic groups most similar to Indonesians are French American Indian (17.4%, a difference of 0.14%), Slavic (17.4%, a difference of 0.26%), Immigrants from Caribbean (17.4%, a difference of 0.33%), Haitian (17.3%, a difference of 0.43%), and Jamaican (17.3%, a difference of 0.47%).
| Demographics | Rating | Rank | Single Father Poverty |
| Lithuanians | 0.4 /100 | #263 | Tragic 17.3% |
| Slovenes | 0.3 /100 | #264 | Tragic 17.3% |
| Poles | 0.3 /100 | #265 | Tragic 17.3% |
| Jamaicans | 0.3 /100 | #266 | Tragic 17.3% |
| Haitians | 0.3 /100 | #267 | Tragic 17.3% |
| Immigrants | Caribbean | 0.3 /100 | #268 | Tragic 17.4% |
| Slavs | 0.3 /100 | #269 | Tragic 17.4% |
| Indonesians | 0.2 /100 | #270 | Tragic 17.4% |
| French American Indians | 0.2 /100 | #271 | Tragic 17.4% |
| Barbadians | 0.1 /100 | #272 | Tragic 17.5% |
| Italians | 0.1 /100 | #273 | Tragic 17.5% |
| Macedonians | 0.1 /100 | #274 | Tragic 17.7% |
| British West Indians | 0.0 /100 | #275 | Tragic 17.7% |
| German Russians | 0.0 /100 | #276 | Tragic 17.7% |
| Lebanese | 0.0 /100 | #277 | Tragic 17.7% |