Mongolian vs Menominee Male Poverty
COMPARE
Mongolian
Menominee
Male Poverty
Male Poverty Comparison
Mongolians
Menominee
11.3%
MALE POVERTY
39.0/ 100
METRIC RATING
182nd/ 347
METRIC RANK
15.3%
MALE POVERTY
0.0/ 100
METRIC RATING
324th/ 347
METRIC RANK
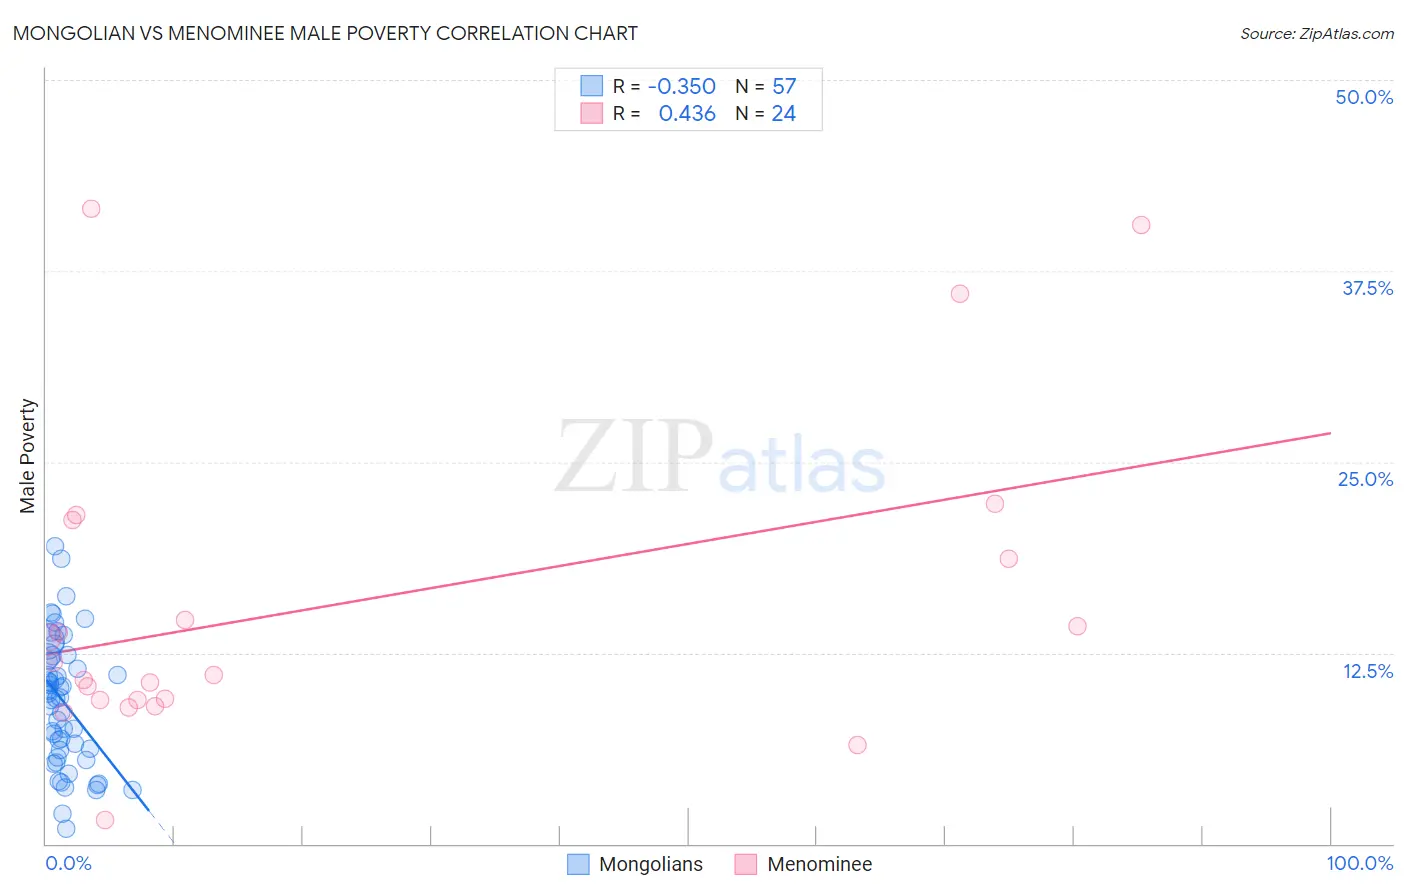
Mongolian vs Menominee Male Poverty Correlation Chart
The statistical analysis conducted on geographies consisting of 140,285,777 people shows a mild negative correlation between the proportion of Mongolians and poverty level among males in the United States with a correlation coefficient (R) of -0.350 and weighted average of 11.3%. Similarly, the statistical analysis conducted on geographies consisting of 45,777,105 people shows a moderate positive correlation between the proportion of Menominee and poverty level among males in the United States with a correlation coefficient (R) of 0.436 and weighted average of 15.3%, a difference of 35.1%.
Male Poverty Correlation Summary
| Measurement | Mongolian | Menominee |
| Minimum | 0.97% | 1.6% |
| Maximum | 19.4% | 41.6% |
| Range | 18.5% | 40.0% |
| Mean | 9.3% | 15.6% |
| Median | 9.6% | 11.5% |
| Interquartile 25% (IQ1) | 5.9% | 9.4% |
| Interquartile 75% (IQ3) | 12.3% | 19.9% |
| Interquartile Range (IQR) | 6.4% | 10.5% |
| Standard Deviation (Sample) | 4.2% | 10.4% |
| Standard Deviation (Population) | 4.2% | 10.2% |
Similar Demographics by Male Poverty
Demographics Similar to Mongolians by Male Poverty
In terms of male poverty, the demographic groups most similar to Mongolians are Immigrants from Costa Rica (11.3%, a difference of 0.050%), Kenyan (11.3%, a difference of 0.060%), Immigrants from Morocco (11.3%, a difference of 0.11%), Immigrants from Syria (11.3%, a difference of 0.13%), and Immigrants from South America (11.3%, a difference of 0.22%).
| Demographics | Rating | Rank | Male Poverty |
| Celtics | 47.5 /100 | #175 | Average 11.2% |
| Immigrants | Fiji | 46.0 /100 | #176 | Average 11.2% |
| Lebanese | 45.6 /100 | #177 | Average 11.2% |
| Immigrants | Cameroon | 44.5 /100 | #178 | Average 11.2% |
| Immigrants | Syria | 40.3 /100 | #179 | Average 11.3% |
| Immigrants | Morocco | 40.1 /100 | #180 | Average 11.3% |
| Immigrants | Costa Rica | 39.5 /100 | #181 | Fair 11.3% |
| Mongolians | 39.0 /100 | #182 | Fair 11.3% |
| Kenyans | 38.4 /100 | #183 | Fair 11.3% |
| Immigrants | South America | 36.9 /100 | #184 | Fair 11.3% |
| Immigrants | Afghanistan | 33.3 /100 | #185 | Fair 11.4% |
| Immigrants | Sierra Leone | 32.9 /100 | #186 | Fair 11.4% |
| Immigrants | Iraq | 31.9 /100 | #187 | Fair 11.4% |
| Sierra Leoneans | 29.9 /100 | #188 | Fair 11.4% |
| Hawaiians | 28.3 /100 | #189 | Fair 11.4% |
Demographics Similar to Menominee by Male Poverty
In terms of male poverty, the demographic groups most similar to Menominee are Yakama (15.3%, a difference of 0.18%), Colville (15.2%, a difference of 0.19%), Central American Indian (15.3%, a difference of 0.29%), Kiowa (15.2%, a difference of 0.58%), and Arapaho (15.1%, a difference of 1.3%).
| Demographics | Rating | Rank | Male Poverty |
| Immigrants | Dominica | 0.0 /100 | #317 | Tragic 14.7% |
| Immigrants | Grenada | 0.0 /100 | #318 | Tragic 14.7% |
| U.S. Virgin Islanders | 0.0 /100 | #319 | Tragic 14.7% |
| Immigrants | Congo | 0.0 /100 | #320 | Tragic 14.7% |
| Arapaho | 0.0 /100 | #321 | Tragic 15.1% |
| Kiowa | 0.0 /100 | #322 | Tragic 15.2% |
| Colville | 0.0 /100 | #323 | Tragic 15.2% |
| Menominee | 0.0 /100 | #324 | Tragic 15.3% |
| Yakama | 0.0 /100 | #325 | Tragic 15.3% |
| Central American Indians | 0.0 /100 | #326 | Tragic 15.3% |
| Paiute | 0.0 /100 | #327 | Tragic 15.8% |
| Blacks/African Americans | 0.0 /100 | #328 | Tragic 15.8% |
| Dominicans | 0.0 /100 | #329 | Tragic 16.1% |
| Immigrants | Dominican Republic | 0.0 /100 | #330 | Tragic 16.2% |
| Ute | 0.0 /100 | #331 | Tragic 16.2% |