Mongolian vs Immigrants from Micronesia In Labor Force | Age 20-24
COMPARE
Mongolian
Immigrants from Micronesia
In Labor Force | Age 20-24
In Labor Force | Age 20-24 Comparison
Mongolians
Immigrants from Micronesia
73.3%
IN LABOR FORCE | AGE 20-24
0.2/ 100
METRIC RATING
276th/ 347
METRIC RANK
77.8%
IN LABOR FORCE | AGE 20-24
100.0/ 100
METRIC RATING
27th/ 347
METRIC RANK
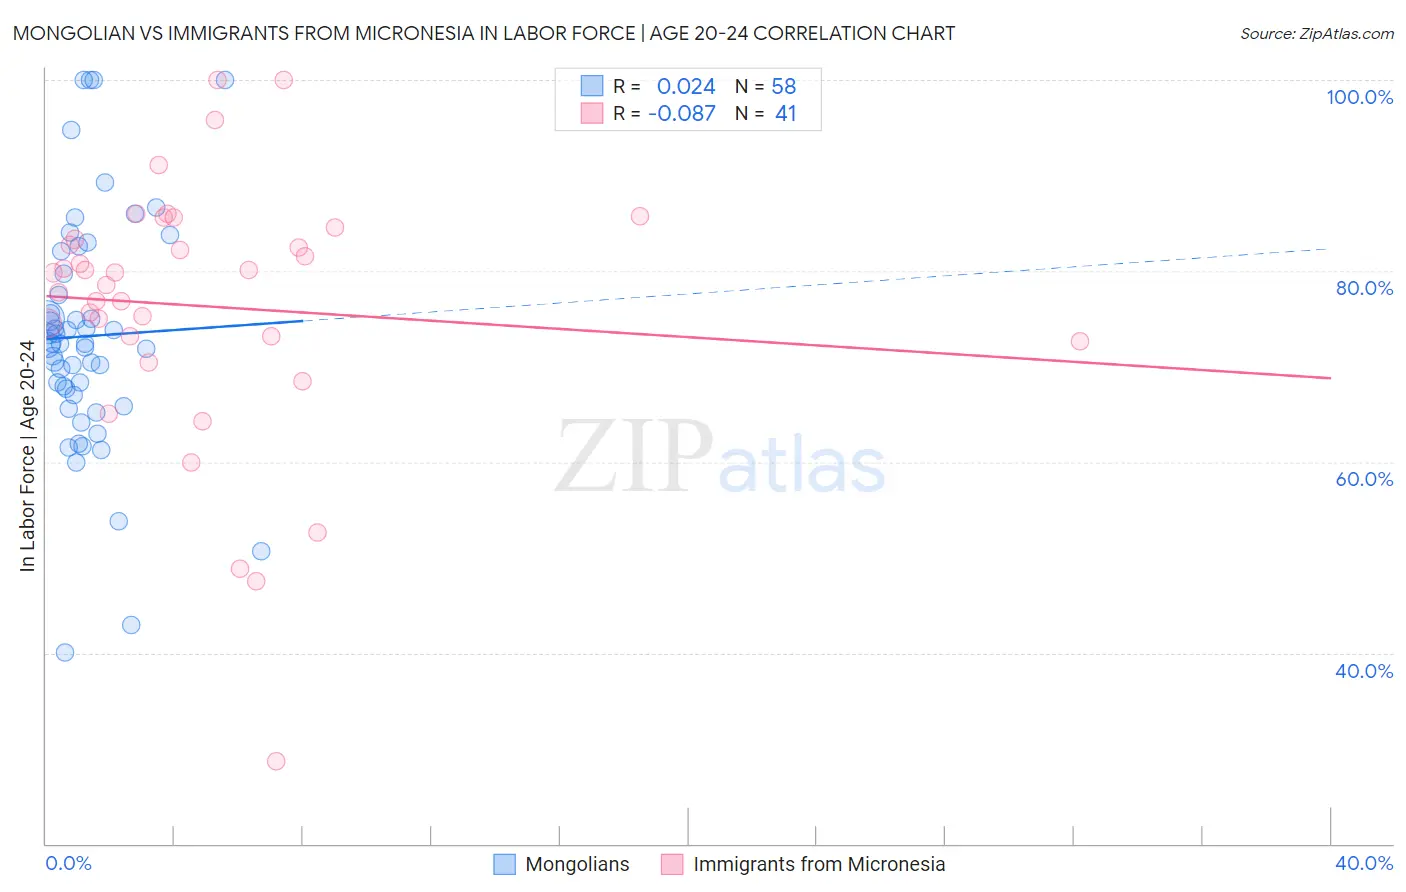
Mongolian vs Immigrants from Micronesia In Labor Force | Age 20-24 Correlation Chart
The statistical analysis conducted on geographies consisting of 140,358,526 people shows no correlation between the proportion of Mongolians and labor force participation rate among population between the ages 20 and 24 in the United States with a correlation coefficient (R) of 0.024 and weighted average of 73.3%. Similarly, the statistical analysis conducted on geographies consisting of 61,601,433 people shows a slight negative correlation between the proportion of Immigrants from Micronesia and labor force participation rate among population between the ages 20 and 24 in the United States with a correlation coefficient (R) of -0.087 and weighted average of 77.8%, a difference of 6.1%.
In Labor Force | Age 20-24 Correlation Summary
| Measurement | Mongolian | Immigrants from Micronesia |
| Minimum | 40.1% | 28.6% |
| Maximum | 100.0% | 100.0% |
| Range | 59.9% | 71.4% |
| Mean | 73.2% | 76.3% |
| Median | 72.4% | 79.8% |
| Interquartile 25% (IQ1) | 67.0% | 72.9% |
| Interquartile 75% (IQ3) | 79.7% | 84.0% |
| Interquartile Range (IQR) | 12.8% | 11.0% |
| Standard Deviation (Sample) | 12.5% | 13.8% |
| Standard Deviation (Population) | 12.4% | 13.6% |
Similar Demographics by In Labor Force | Age 20-24
Demographics Similar to Mongolians by In Labor Force | Age 20-24
In terms of in labor force | age 20-24, the demographic groups most similar to Mongolians are Immigrants from South America (73.3%, a difference of 0.010%), Immigrants from Malaysia (73.3%, a difference of 0.010%), Cypriot (73.3%, a difference of 0.030%), Venezuelan (73.3%, a difference of 0.030%), and Immigrants from Colombia (73.4%, a difference of 0.070%).
| Demographics | Rating | Rank | In Labor Force | Age 20-24 |
| Colombians | 0.3 /100 | #269 | Tragic 73.5% |
| Immigrants | Russia | 0.3 /100 | #270 | Tragic 73.5% |
| Immigrants | Indonesia | 0.3 /100 | #271 | Tragic 73.4% |
| Belizeans | 0.3 /100 | #272 | Tragic 73.4% |
| Cheyenne | 0.2 /100 | #273 | Tragic 73.4% |
| Immigrants | Colombia | 0.2 /100 | #274 | Tragic 73.4% |
| Immigrants | South America | 0.2 /100 | #275 | Tragic 73.3% |
| Mongolians | 0.2 /100 | #276 | Tragic 73.3% |
| Immigrants | Malaysia | 0.2 /100 | #277 | Tragic 73.3% |
| Cypriots | 0.2 /100 | #278 | Tragic 73.3% |
| Venezuelans | 0.2 /100 | #279 | Tragic 73.3% |
| Bahamians | 0.1 /100 | #280 | Tragic 73.3% |
| Immigrants | Venezuela | 0.1 /100 | #281 | Tragic 73.2% |
| Immigrants | Spain | 0.1 /100 | #282 | Tragic 73.2% |
| Immigrants | Bahamas | 0.1 /100 | #283 | Tragic 73.2% |
Demographics Similar to Immigrants from Micronesia by In Labor Force | Age 20-24
In terms of in labor force | age 20-24, the demographic groups most similar to Immigrants from Micronesia are Belgian (77.8%, a difference of 0.040%), Tongan (77.9%, a difference of 0.12%), Slovak (77.7%, a difference of 0.12%), Tlingit-Haida (77.9%, a difference of 0.14%), and Swiss (77.7%, a difference of 0.14%).
| Demographics | Rating | Rank | In Labor Force | Age 20-24 |
| French Canadians | 100.0 /100 | #20 | Exceptional 78.1% |
| Puget Sound Salish | 100.0 /100 | #21 | Exceptional 78.0% |
| Pennsylvania Germans | 100.0 /100 | #22 | Exceptional 78.0% |
| Yugoslavians | 100.0 /100 | #23 | Exceptional 78.0% |
| Liberians | 100.0 /100 | #24 | Exceptional 78.0% |
| Tlingit-Haida | 100.0 /100 | #25 | Exceptional 77.9% |
| Tongans | 100.0 /100 | #26 | Exceptional 77.9% |
| Immigrants | Micronesia | 100.0 /100 | #27 | Exceptional 77.8% |
| Belgians | 100.0 /100 | #28 | Exceptional 77.8% |
| Slovaks | 100.0 /100 | #29 | Exceptional 77.7% |
| Swiss | 100.0 /100 | #30 | Exceptional 77.7% |
| Poles | 100.0 /100 | #31 | Exceptional 77.6% |
| English | 100.0 /100 | #32 | Exceptional 77.6% |
| Immigrants | Ethiopia | 100.0 /100 | #33 | Exceptional 77.5% |
| German Russians | 100.0 /100 | #34 | Exceptional 77.5% |