Mongolian vs Panamanian Family Poverty
COMPARE
Mongolian
Panamanian
Family Poverty
Family Poverty Comparison
Mongolians
Panamanians
8.6%
FAMILY POVERTY
80.4/ 100
METRIC RATING
149th/ 347
METRIC RANK
9.8%
FAMILY POVERTY
5.6/ 100
METRIC RATING
218th/ 347
METRIC RANK
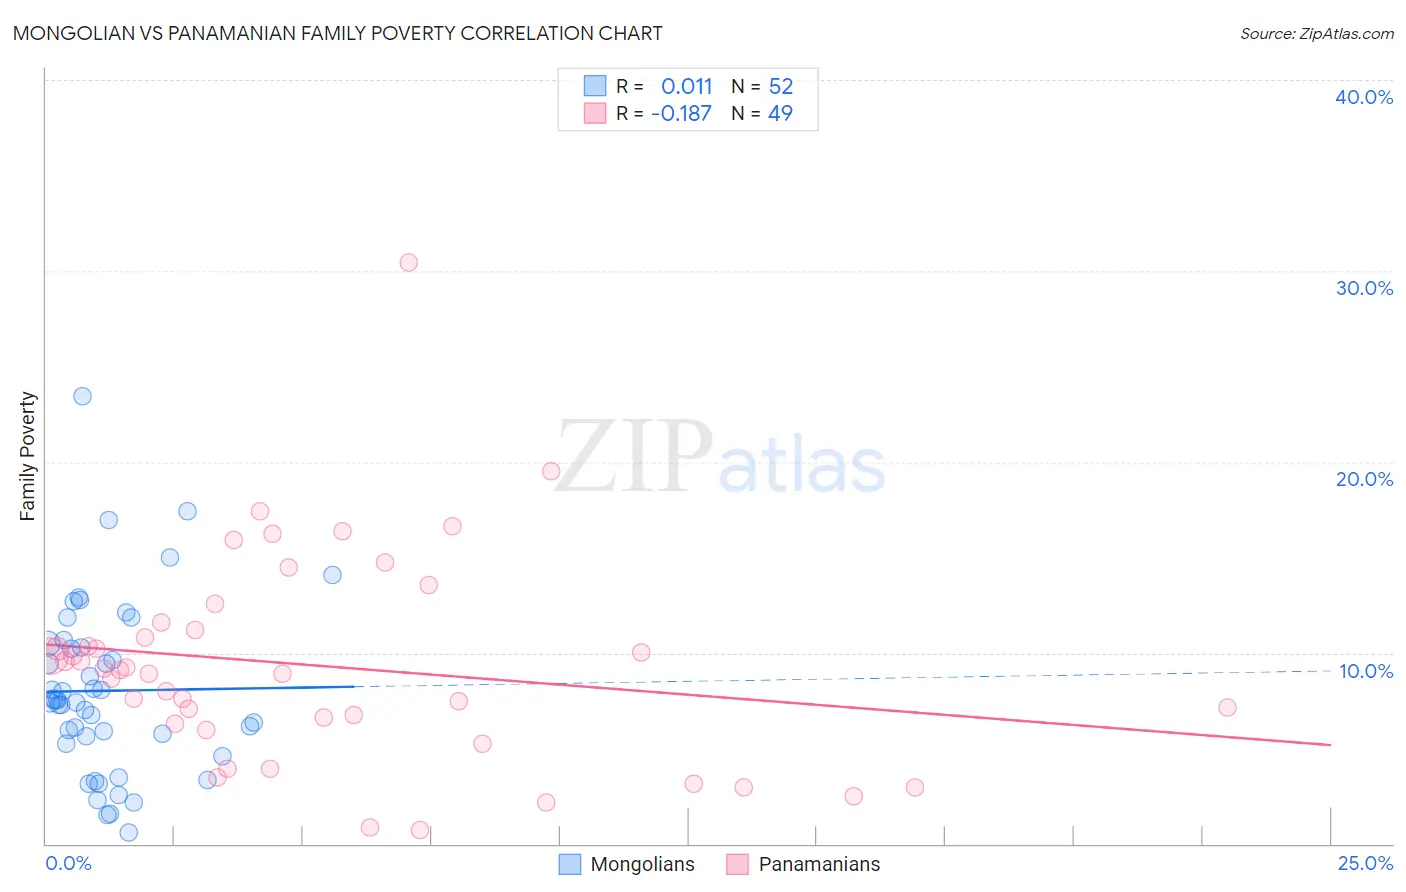
Mongolian vs Panamanian Family Poverty Correlation Chart
The statistical analysis conducted on geographies consisting of 140,209,736 people shows no correlation between the proportion of Mongolians and poverty level among families in the United States with a correlation coefficient (R) of 0.011 and weighted average of 8.6%. Similarly, the statistical analysis conducted on geographies consisting of 280,803,114 people shows a poor negative correlation between the proportion of Panamanians and poverty level among families in the United States with a correlation coefficient (R) of -0.187 and weighted average of 9.8%, a difference of 14.5%.
Family Poverty Correlation Summary
| Measurement | Mongolian | Panamanian |
| Minimum | 0.58% | 0.72% |
| Maximum | 23.4% | 30.4% |
| Range | 22.8% | 29.7% |
| Mean | 8.0% | 9.3% |
| Median | 7.5% | 9.1% |
| Interquartile 25% (IQ1) | 5.4% | 6.1% |
| Interquartile 75% (IQ3) | 10.4% | 11.4% |
| Interquartile Range (IQR) | 4.9% | 5.3% |
| Standard Deviation (Sample) | 4.5% | 5.5% |
| Standard Deviation (Population) | 4.5% | 5.4% |
Similar Demographics by Family Poverty
Demographics Similar to Mongolians by Family Poverty
In terms of family poverty, the demographic groups most similar to Mongolians are Syrian (8.6%, a difference of 0.0%), Brazilian (8.6%, a difference of 0.050%), Samoan (8.6%, a difference of 0.13%), Immigrants from Spain (8.6%, a difference of 0.26%), and Scotch-Irish (8.6%, a difference of 0.41%).
| Demographics | Rating | Rank | Family Poverty |
| Yugoslavians | 83.5 /100 | #142 | Excellent 8.5% |
| Immigrants | Germany | 83.3 /100 | #143 | Excellent 8.5% |
| Albanians | 83.3 /100 | #144 | Excellent 8.5% |
| Immigrants | South Eastern Asia | 83.2 /100 | #145 | Excellent 8.5% |
| Immigrants | Belarus | 83.2 /100 | #146 | Excellent 8.5% |
| Immigrants | Jordan | 83.0 /100 | #147 | Excellent 8.5% |
| Scotch-Irish | 82.2 /100 | #148 | Excellent 8.6% |
| Mongolians | 80.4 /100 | #149 | Excellent 8.6% |
| Syrians | 80.3 /100 | #150 | Excellent 8.6% |
| Brazilians | 80.1 /100 | #151 | Excellent 8.6% |
| Samoans | 79.8 /100 | #152 | Good 8.6% |
| Immigrants | Spain | 79.1 /100 | #153 | Good 8.6% |
| Immigrants | Vietnam | 75.4 /100 | #154 | Good 8.7% |
| Immigrants | Kuwait | 73.6 /100 | #155 | Good 8.7% |
| Immigrants | Oceania | 71.2 /100 | #156 | Good 8.7% |
Demographics Similar to Panamanians by Family Poverty
In terms of family poverty, the demographic groups most similar to Panamanians are Immigrants from Eritrea (9.9%, a difference of 0.13%), Bermudan (9.9%, a difference of 0.18%), American (9.8%, a difference of 0.32%), Immigrants from Cambodia (9.9%, a difference of 0.46%), and Japanese (9.9%, a difference of 0.49%).
| Demographics | Rating | Rank | Family Poverty |
| Malaysians | 10.6 /100 | #211 | Poor 9.6% |
| Immigrants | Thailand | 9.7 /100 | #212 | Tragic 9.7% |
| Osage | 8.0 /100 | #213 | Tragic 9.7% |
| Immigrants | Micronesia | 6.7 /100 | #214 | Tragic 9.8% |
| Immigrants | Nonimmigrants | 6.7 /100 | #215 | Tragic 9.8% |
| Moroccans | 6.5 /100 | #216 | Tragic 9.8% |
| Americans | 6.2 /100 | #217 | Tragic 9.8% |
| Panamanians | 5.6 /100 | #218 | Tragic 9.8% |
| Immigrants | Eritrea | 5.4 /100 | #219 | Tragic 9.9% |
| Bermudans | 5.3 /100 | #220 | Tragic 9.9% |
| Immigrants | Cambodia | 4.8 /100 | #221 | Tragic 9.9% |
| Japanese | 4.8 /100 | #222 | Tragic 9.9% |
| Immigrants | Africa | 4.3 /100 | #223 | Tragic 9.9% |
| Marshallese | 3.9 /100 | #224 | Tragic 9.9% |
| Immigrants | Immigrants | 3.6 /100 | #225 | Tragic 10.0% |