Blackfeet vs Immigrants from Western Asia Male Poverty
COMPARE
Blackfeet
Immigrants from Western Asia
Male Poverty
Male Poverty Comparison
Blackfeet
Immigrants from Western Asia
14.0%
MALE POVERTY
0.0/ 100
METRIC RATING
298th/ 347
METRIC RANK
11.8%
MALE POVERTY
9.8/ 100
METRIC RATING
203rd/ 347
METRIC RANK
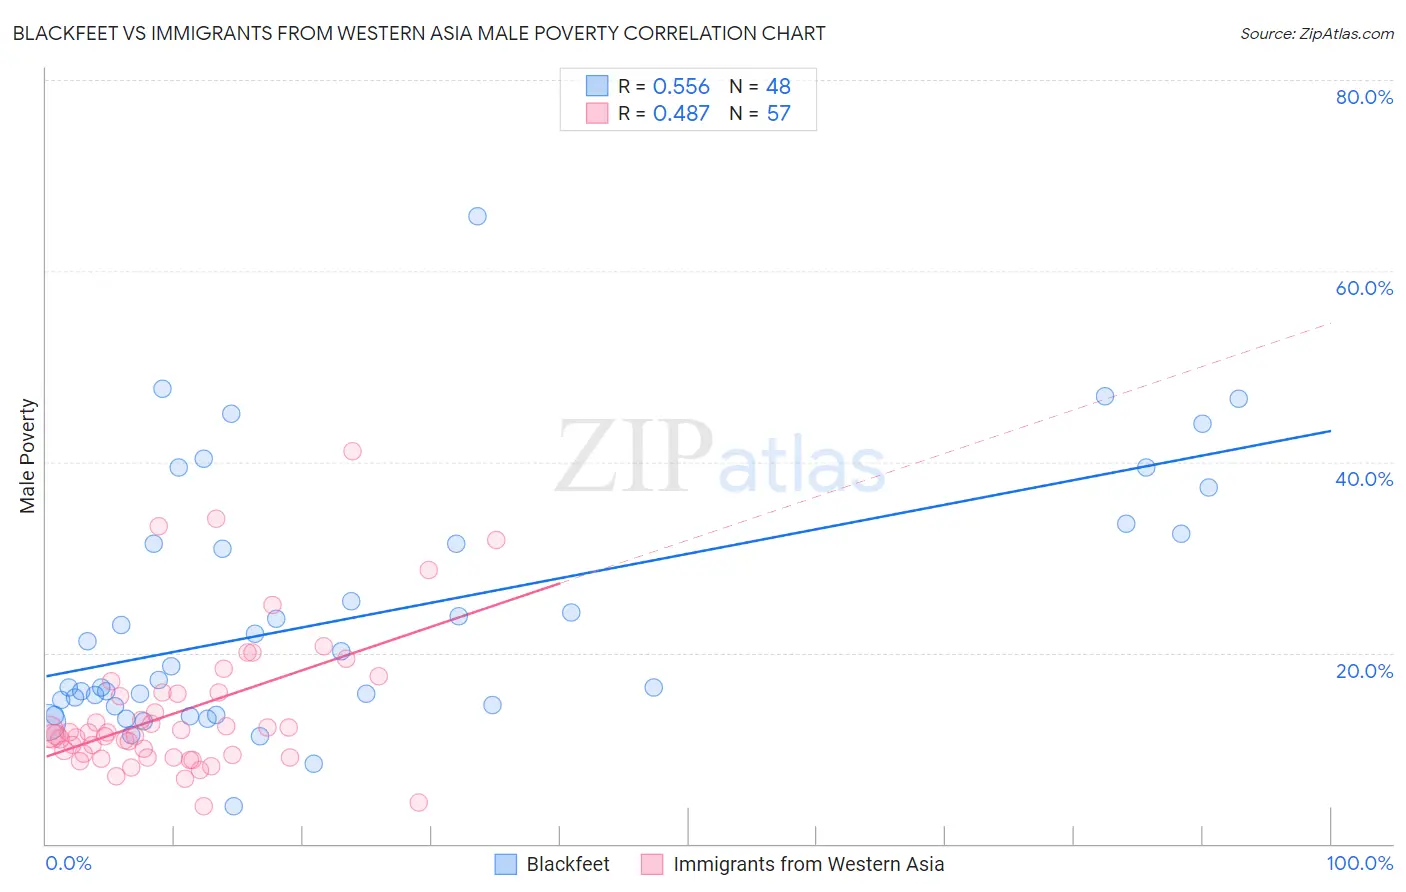
Blackfeet vs Immigrants from Western Asia Male Poverty Correlation Chart
The statistical analysis conducted on geographies consisting of 309,436,017 people shows a substantial positive correlation between the proportion of Blackfeet and poverty level among males in the United States with a correlation coefficient (R) of 0.556 and weighted average of 14.0%. Similarly, the statistical analysis conducted on geographies consisting of 404,054,336 people shows a moderate positive correlation between the proportion of Immigrants from Western Asia and poverty level among males in the United States with a correlation coefficient (R) of 0.487 and weighted average of 11.8%, a difference of 18.7%.
Male Poverty Correlation Summary
| Measurement | Blackfeet | Immigrants from Western Asia |
| Minimum | 3.9% | 4.0% |
| Maximum | 65.7% | 41.1% |
| Range | 61.8% | 37.1% |
| Mean | 23.9% | 13.9% |
| Median | 17.9% | 11.7% |
| Interquartile 25% (IQ1) | 14.4% | 9.2% |
| Interquartile 75% (IQ3) | 31.9% | 15.9% |
| Interquartile Range (IQR) | 17.5% | 6.7% |
| Standard Deviation (Sample) | 13.2% | 7.5% |
| Standard Deviation (Population) | 13.0% | 7.4% |
Similar Demographics by Male Poverty
Demographics Similar to Blackfeet by Male Poverty
In terms of male poverty, the demographic groups most similar to Blackfeet are Inupiat (14.0%, a difference of 0.030%), Immigrants from Guatemala (14.0%, a difference of 0.10%), Immigrants from Mexico (14.0%, a difference of 0.22%), Immigrants from Senegal (14.0%, a difference of 0.29%), and Immigrants from Caribbean (14.0%, a difference of 0.34%).
| Demographics | Rating | Rank | Male Poverty |
| Vietnamese | 0.0 /100 | #291 | Tragic 13.8% |
| Indonesians | 0.0 /100 | #292 | Tragic 13.8% |
| Immigrants | Belize | 0.0 /100 | #293 | Tragic 13.8% |
| Hispanics or Latinos | 0.0 /100 | #294 | Tragic 13.9% |
| Immigrants | Central America | 0.0 /100 | #295 | Tragic 13.9% |
| Cajuns | 0.0 /100 | #296 | Tragic 13.9% |
| Inupiat | 0.0 /100 | #297 | Tragic 14.0% |
| Blackfeet | 0.0 /100 | #298 | Tragic 14.0% |
| Immigrants | Guatemala | 0.0 /100 | #299 | Tragic 14.0% |
| Immigrants | Mexico | 0.0 /100 | #300 | Tragic 14.0% |
| Immigrants | Senegal | 0.0 /100 | #301 | Tragic 14.0% |
| Immigrants | Caribbean | 0.0 /100 | #302 | Tragic 14.0% |
| Bahamians | 0.0 /100 | #303 | Tragic 14.1% |
| Senegalese | 0.0 /100 | #304 | Tragic 14.1% |
| Immigrants | Bangladesh | 0.0 /100 | #305 | Tragic 14.1% |
Demographics Similar to Immigrants from Western Asia by Male Poverty
In terms of male poverty, the demographic groups most similar to Immigrants from Western Asia are Aleut (11.8%, a difference of 0.14%), Immigrants from Uganda (11.8%, a difference of 0.36%), Spaniard (11.7%, a difference of 0.86%), Immigrants from Lebanon (11.7%, a difference of 0.87%), and Spanish (11.7%, a difference of 0.97%).
| Demographics | Rating | Rank | Male Poverty |
| Hmong | 15.8 /100 | #196 | Poor 11.6% |
| Delaware | 15.4 /100 | #197 | Poor 11.7% |
| Iraqis | 14.7 /100 | #198 | Poor 11.7% |
| Spanish | 14.1 /100 | #199 | Poor 11.7% |
| Immigrants | Lebanon | 13.6 /100 | #200 | Poor 11.7% |
| Spaniards | 13.5 /100 | #201 | Poor 11.7% |
| Aleuts | 10.4 /100 | #202 | Poor 11.8% |
| Immigrants | Western Asia | 9.8 /100 | #203 | Tragic 11.8% |
| Immigrants | Uganda | 8.5 /100 | #204 | Tragic 11.8% |
| Panamanians | 6.2 /100 | #205 | Tragic 11.9% |
| Immigrants | Eastern Africa | 5.4 /100 | #206 | Tragic 12.0% |
| Malaysians | 5.2 /100 | #207 | Tragic 12.0% |
| Immigrants | Immigrants | 4.5 /100 | #208 | Tragic 12.0% |
| Immigrants | Azores | 4.3 /100 | #209 | Tragic 12.0% |
| Moroccans | 4.2 /100 | #210 | Tragic 12.0% |