Mexican American Indian vs Immigrants from Cuba Single Father Poverty
COMPARE
Mexican American Indian
Immigrants from Cuba
Single Father Poverty
Single Father Poverty Comparison
Mexican American Indians
Immigrants from Cuba
15.5%
SINGLE FATHER POVERTY
98.7/ 100
METRIC RATING
90th/ 347
METRIC RANK
16.4%
SINGLE FATHER POVERTY
41.6/ 100
METRIC RATING
178th/ 347
METRIC RANK
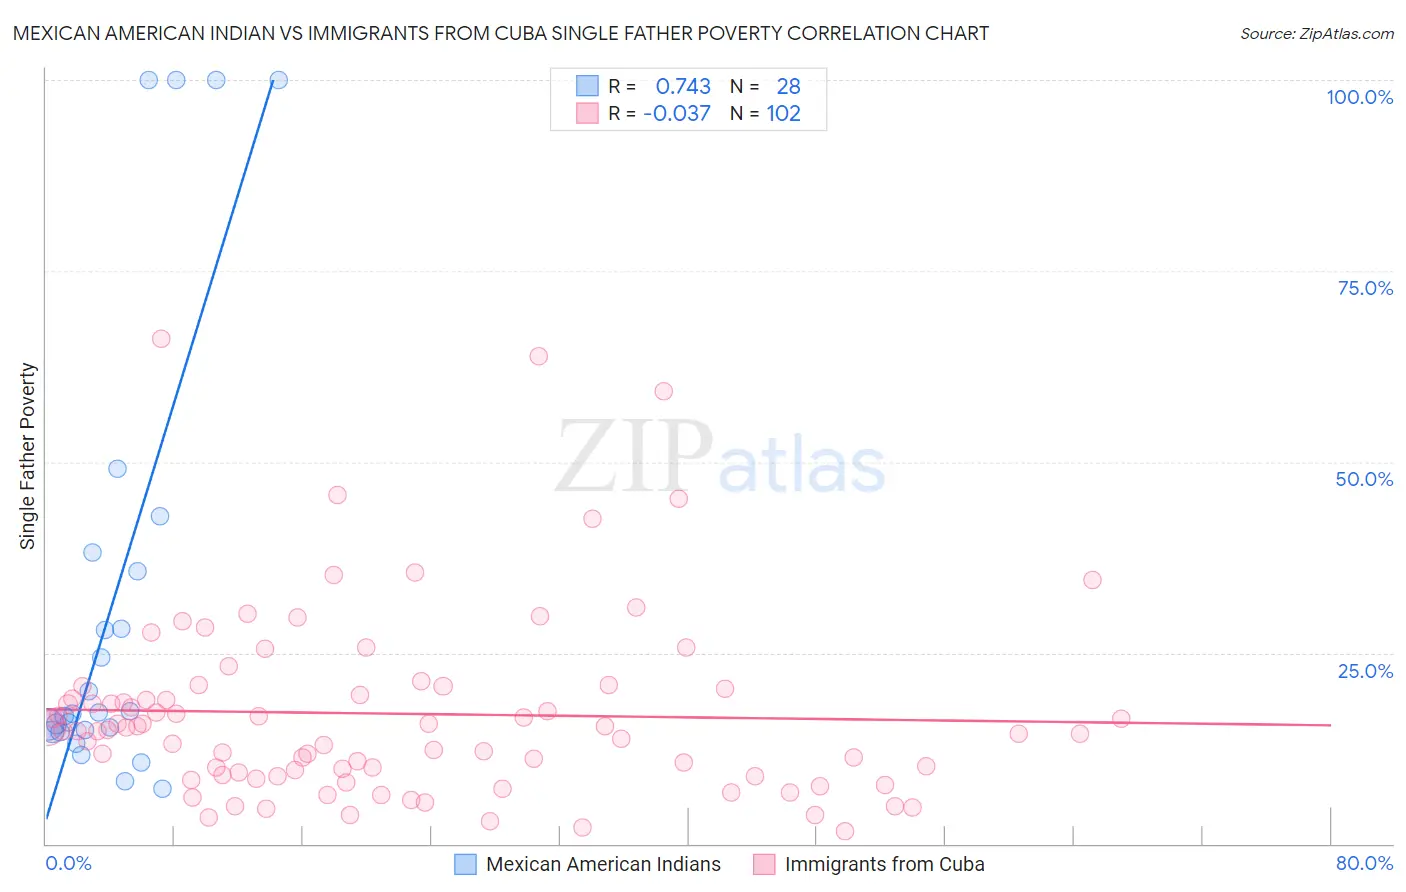
Mexican American Indian vs Immigrants from Cuba Single Father Poverty Correlation Chart
The statistical analysis conducted on geographies consisting of 266,902,883 people shows a strong positive correlation between the proportion of Mexican American Indians and poverty level among single fathers in the United States with a correlation coefficient (R) of 0.743 and weighted average of 15.5%. Similarly, the statistical analysis conducted on geographies consisting of 265,819,511 people shows no correlation between the proportion of Immigrants from Cuba and poverty level among single fathers in the United States with a correlation coefficient (R) of -0.037 and weighted average of 16.4%, a difference of 5.4%.
Single Father Poverty Correlation Summary
| Measurement | Mexican American Indian | Immigrants from Cuba |
| Minimum | 7.3% | 1.6% |
| Maximum | 100.0% | 66.1% |
| Range | 92.7% | 64.5% |
| Mean | 31.8% | 17.0% |
| Median | 17.1% | 14.9% |
| Interquartile 25% (IQ1) | 14.8% | 9.0% |
| Interquartile 75% (IQ3) | 36.9% | 20.3% |
| Interquartile Range (IQR) | 22.1% | 11.3% |
| Standard Deviation (Sample) | 30.1% | 12.2% |
| Standard Deviation (Population) | 29.6% | 12.2% |
Similar Demographics by Single Father Poverty
Demographics Similar to Mexican American Indians by Single Father Poverty
In terms of single father poverty, the demographic groups most similar to Mexican American Indians are Immigrants from Romania (15.5%, a difference of 0.10%), Immigrants from Serbia (15.5%, a difference of 0.21%), Immigrants from Korea (15.5%, a difference of 0.23%), Basque (15.5%, a difference of 0.25%), and Burmese (15.5%, a difference of 0.29%).
| Demographics | Rating | Rank | Single Father Poverty |
| Chinese | 99.3 /100 | #83 | Exceptional 15.4% |
| Peruvians | 99.2 /100 | #84 | Exceptional 15.4% |
| Immigrants | Oceania | 99.1 /100 | #85 | Exceptional 15.4% |
| Immigrants | Russia | 99.0 /100 | #86 | Exceptional 15.5% |
| Brazilians | 99.0 /100 | #87 | Exceptional 15.5% |
| Burmese | 99.0 /100 | #88 | Exceptional 15.5% |
| Immigrants | Korea | 99.0 /100 | #89 | Exceptional 15.5% |
| Mexican American Indians | 98.7 /100 | #90 | Exceptional 15.5% |
| Immigrants | Romania | 98.6 /100 | #91 | Exceptional 15.5% |
| Immigrants | Serbia | 98.5 /100 | #92 | Exceptional 15.5% |
| Basques | 98.4 /100 | #93 | Exceptional 15.5% |
| Immigrants | Uruguay | 98.2 /100 | #94 | Exceptional 15.6% |
| Immigrants | Kazakhstan | 98.2 /100 | #95 | Exceptional 15.6% |
| Immigrants | Belgium | 98.1 /100 | #96 | Exceptional 15.6% |
| Yaqui | 98.1 /100 | #97 | Exceptional 15.6% |
Demographics Similar to Immigrants from Cuba by Single Father Poverty
In terms of single father poverty, the demographic groups most similar to Immigrants from Cuba are Serbian (16.4%, a difference of 0.030%), Immigrants from South Africa (16.3%, a difference of 0.12%), Immigrants from Latin America (16.4%, a difference of 0.20%), Immigrants from Western Africa (16.4%, a difference of 0.26%), and Immigrants from Italy (16.4%, a difference of 0.27%).
| Demographics | Rating | Rank | Single Father Poverty |
| Immigrants | Morocco | 50.7 /100 | #171 | Average 16.3% |
| Immigrants | Sierra Leone | 50.1 /100 | #172 | Average 16.3% |
| Immigrants | St. Vincent and the Grenadines | 50.0 /100 | #173 | Average 16.3% |
| Swedes | 50.0 /100 | #174 | Average 16.3% |
| Immigrants | Ecuador | 49.7 /100 | #175 | Average 16.3% |
| Vietnamese | 48.0 /100 | #176 | Average 16.3% |
| Immigrants | South Africa | 44.2 /100 | #177 | Average 16.3% |
| Immigrants | Cuba | 41.6 /100 | #178 | Average 16.4% |
| Serbians | 40.9 /100 | #179 | Average 16.4% |
| Immigrants | Latin America | 37.2 /100 | #180 | Fair 16.4% |
| Immigrants | Western Africa | 36.0 /100 | #181 | Fair 16.4% |
| Immigrants | Italy | 35.7 /100 | #182 | Fair 16.4% |
| Aleuts | 35.3 /100 | #183 | Fair 16.4% |
| Cambodians | 34.6 /100 | #184 | Fair 16.4% |
| Panamanians | 33.6 /100 | #185 | Fair 16.4% |