Croatian vs Potawatomi Female Poverty Among 25-34 Year Olds
COMPARE
Croatian
Potawatomi
Female Poverty Among 25-34 Year Olds
Female Poverty Among 25-34 Year Olds Comparison
Croatians
Potawatomi
12.5%
FEMALE POVERTY AMONG 25-34 YEAR OLDS
97.5/ 100
METRIC RATING
86th/ 347
METRIC RANK
16.5%
FEMALE POVERTY AMONG 25-34 YEAR OLDS
0.0/ 100
METRIC RATING
293rd/ 347
METRIC RANK
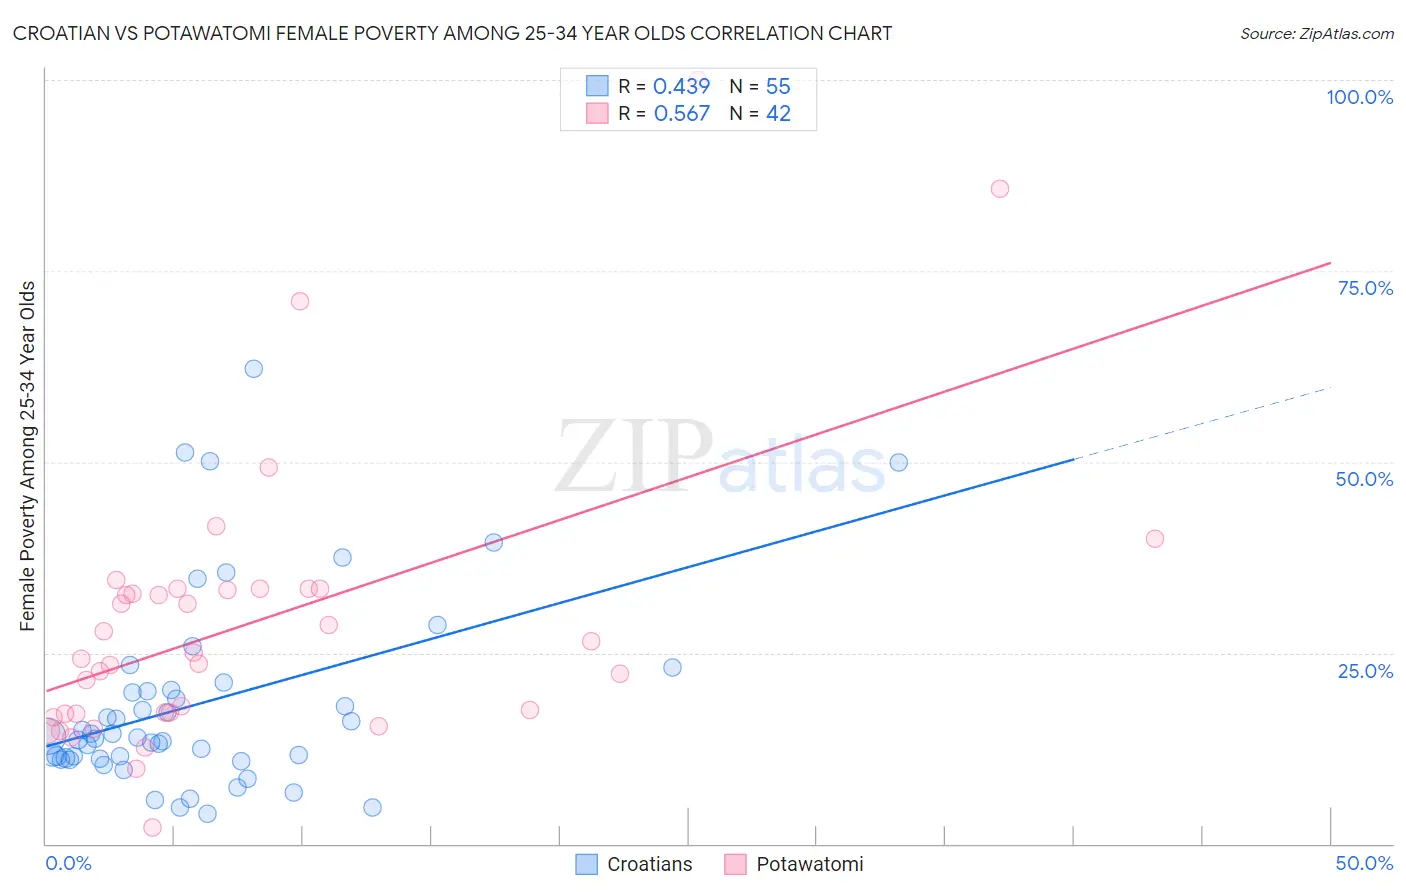
Croatian vs Potawatomi Female Poverty Among 25-34 Year Olds Correlation Chart
The statistical analysis conducted on geographies consisting of 368,515,977 people shows a moderate positive correlation between the proportion of Croatians and poverty level among females between the ages 25 and 34 in the United States with a correlation coefficient (R) of 0.439 and weighted average of 12.5%. Similarly, the statistical analysis conducted on geographies consisting of 117,213,572 people shows a substantial positive correlation between the proportion of Potawatomi and poverty level among females between the ages 25 and 34 in the United States with a correlation coefficient (R) of 0.567 and weighted average of 16.5%, a difference of 32.1%.
Female Poverty Among 25-34 Year Olds Correlation Summary
| Measurement | Croatian | Potawatomi |
| Minimum | 4.0% | 2.2% |
| Maximum | 62.3% | 100.0% |
| Range | 58.3% | 97.8% |
| Mean | 18.3% | 28.9% |
| Median | 13.9% | 24.6% |
| Interquartile 25% (IQ1) | 11.1% | 17.0% |
| Interquartile 75% (IQ3) | 20.2% | 33.3% |
| Interquartile Range (IQR) | 9.0% | 16.3% |
| Standard Deviation (Sample) | 12.7% | 18.8% |
| Standard Deviation (Population) | 12.6% | 18.6% |
Similar Demographics by Female Poverty Among 25-34 Year Olds
Demographics Similar to Croatians by Female Poverty Among 25-34 Year Olds
In terms of female poverty among 25-34 year olds, the demographic groups most similar to Croatians are Immigrants from South Eastern Asia (12.5%, a difference of 0.010%), Argentinean (12.5%, a difference of 0.030%), Immigrants from Austria (12.5%, a difference of 0.10%), Immigrants from Latvia (12.5%, a difference of 0.13%), and Albanian (12.5%, a difference of 0.18%).
| Demographics | Rating | Rank | Female Poverty Among 25-34 Year Olds |
| Immigrants | Jordan | 98.5 /100 | #79 | Exceptional 12.4% |
| Immigrants | Malaysia | 98.3 /100 | #80 | Exceptional 12.4% |
| Immigrants | Kazakhstan | 98.1 /100 | #81 | Exceptional 12.4% |
| Ethiopians | 98.0 /100 | #82 | Exceptional 12.4% |
| Albanians | 97.7 /100 | #83 | Exceptional 12.5% |
| Immigrants | Latvia | 97.7 /100 | #84 | Exceptional 12.5% |
| Immigrants | South Eastern Asia | 97.6 /100 | #85 | Exceptional 12.5% |
| Croatians | 97.5 /100 | #86 | Exceptional 12.5% |
| Argentineans | 97.5 /100 | #87 | Exceptional 12.5% |
| Immigrants | Austria | 97.4 /100 | #88 | Exceptional 12.5% |
| Italians | 97.2 /100 | #89 | Exceptional 12.5% |
| Immigrants | Albania | 97.1 /100 | #90 | Exceptional 12.5% |
| Norwegians | 96.9 /100 | #91 | Exceptional 12.6% |
| Immigrants | Armenia | 96.9 /100 | #92 | Exceptional 12.6% |
| Palestinians | 96.9 /100 | #93 | Exceptional 12.6% |
Demographics Similar to Potawatomi by Female Poverty Among 25-34 Year Olds
In terms of female poverty among 25-34 year olds, the demographic groups most similar to Potawatomi are Immigrants from Dominica (16.5%, a difference of 0.27%), Comanche (16.5%, a difference of 0.28%), Immigrants from Central America (16.6%, a difference of 0.36%), Mexican (16.6%, a difference of 0.44%), and Indonesian (16.4%, a difference of 0.57%).
| Demographics | Rating | Rank | Female Poverty Among 25-34 Year Olds |
| Cape Verdeans | 0.0 /100 | #286 | Tragic 16.3% |
| Americans | 0.0 /100 | #287 | Tragic 16.4% |
| Guatemalans | 0.0 /100 | #288 | Tragic 16.4% |
| Osage | 0.0 /100 | #289 | Tragic 16.4% |
| Indonesians | 0.0 /100 | #290 | Tragic 16.4% |
| Comanche | 0.0 /100 | #291 | Tragic 16.5% |
| Immigrants | Dominica | 0.0 /100 | #292 | Tragic 16.5% |
| Potawatomi | 0.0 /100 | #293 | Tragic 16.5% |
| Immigrants | Central America | 0.0 /100 | #294 | Tragic 16.6% |
| Mexicans | 0.0 /100 | #295 | Tragic 16.6% |
| Hispanics or Latinos | 0.0 /100 | #296 | Tragic 16.6% |
| Immigrants | Guatemala | 0.0 /100 | #297 | Tragic 16.6% |
| Blackfeet | 0.0 /100 | #298 | Tragic 16.7% |
| Spanish Americans | 0.0 /100 | #299 | Tragic 16.7% |
| U.S. Virgin Islanders | 0.0 /100 | #300 | Tragic 16.7% |