Menominee vs Dominican Receiving Food Stamps
COMPARE
Menominee
Dominican
Receiving Food Stamps
Receiving Food Stamps Comparison
Menominee
Dominicans
17.2%
RECEIVING FOOD STAMPS
0.0/ 100
METRIC RATING
318th/ 347
METRIC RANK
21.4%
RECEIVING FOOD STAMPS
0.0/ 100
METRIC RATING
338th/ 347
METRIC RANK
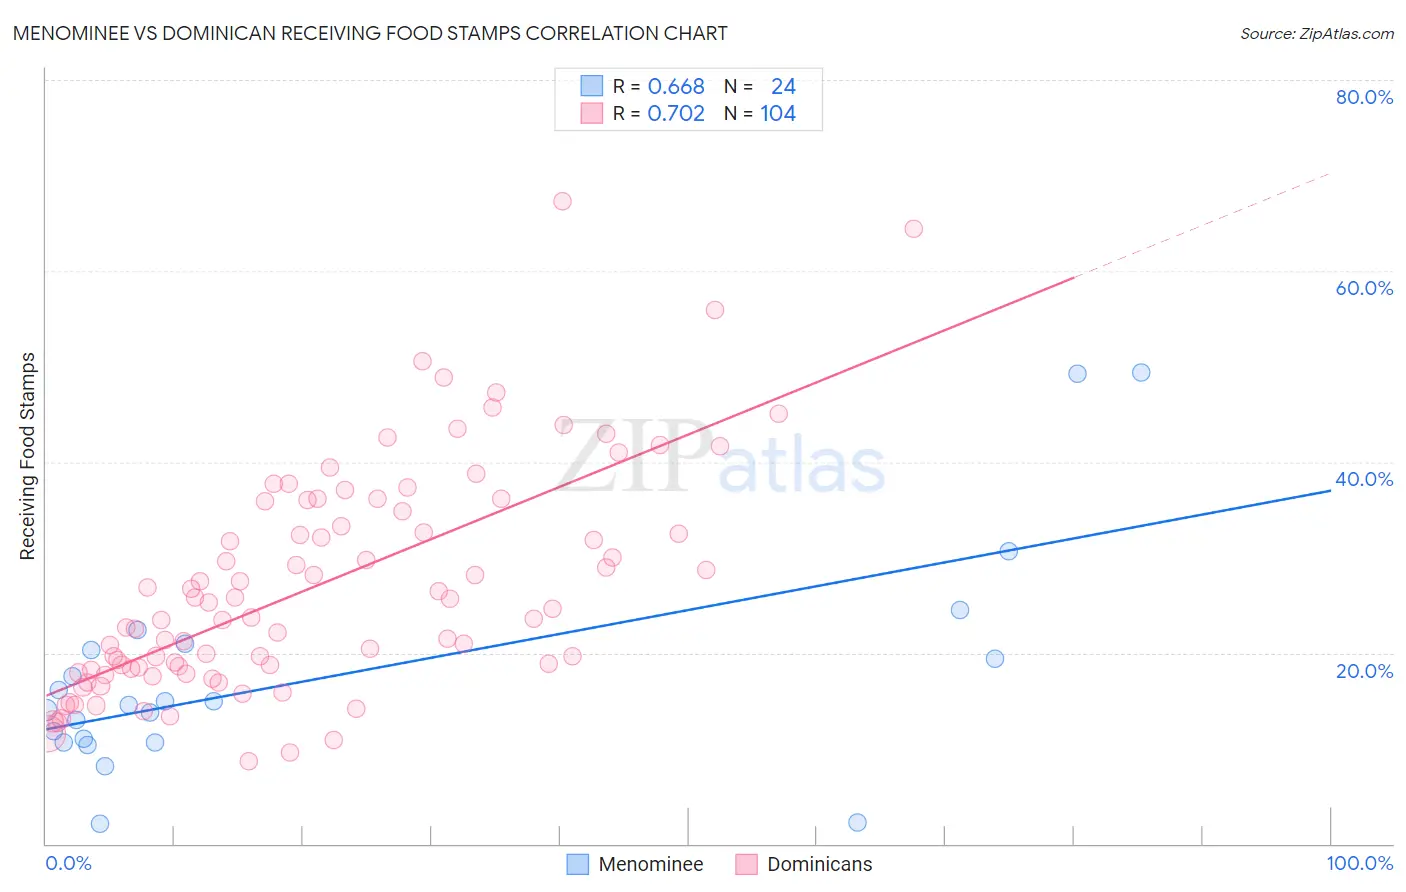
Menominee vs Dominican Receiving Food Stamps Correlation Chart
The statistical analysis conducted on geographies consisting of 45,777,260 people shows a significant positive correlation between the proportion of Menominee and percentage of population receiving government assistance and/or food stamps in the United States with a correlation coefficient (R) of 0.668 and weighted average of 17.2%. Similarly, the statistical analysis conducted on geographies consisting of 353,995,756 people shows a strong positive correlation between the proportion of Dominicans and percentage of population receiving government assistance and/or food stamps in the United States with a correlation coefficient (R) of 0.702 and weighted average of 21.4%, a difference of 24.2%.
Receiving Food Stamps Correlation Summary
| Measurement | Menominee | Dominican |
| Minimum | 2.1% | 8.7% |
| Maximum | 49.4% | 67.3% |
| Range | 47.3% | 58.6% |
| Mean | 17.6% | 27.0% |
| Median | 14.7% | 24.1% |
| Interquartile 25% (IQ1) | 10.8% | 18.3% |
| Interquartile 75% (IQ3) | 20.7% | 35.4% |
| Interquartile Range (IQR) | 9.9% | 17.1% |
| Standard Deviation (Sample) | 11.7% | 11.8% |
| Standard Deviation (Population) | 11.4% | 11.7% |
Demographics Similar to Menominee and Dominicans by Receiving Food Stamps
In terms of receiving food stamps, the demographic groups most similar to Menominee are Immigrants from St. Vincent and the Grenadines (17.2%, a difference of 0.18%), Immigrants from Nicaragua (17.2%, a difference of 0.26%), Native/Alaskan (17.3%, a difference of 0.44%), Immigrants from Grenada (17.8%, a difference of 3.4%), and Haitian (17.8%, a difference of 3.4%). Similarly, the demographic groups most similar to Dominicans are Cape Verdean (21.1%, a difference of 1.4%), Navajo (21.1%, a difference of 1.5%), Immigrants from Cuba (20.8%, a difference of 2.6%), Yuman (20.2%, a difference of 5.6%), and Inupiat (20.1%, a difference of 6.5%).
| Demographics | Rating | Rank | Receiving Food Stamps |
| Menominee | 0.0 /100 | #318 | Tragic 17.2% |
| Immigrants | St. Vincent and the Grenadines | 0.0 /100 | #319 | Tragic 17.2% |
| Immigrants | Nicaragua | 0.0 /100 | #320 | Tragic 17.2% |
| Natives/Alaskans | 0.0 /100 | #321 | Tragic 17.3% |
| Immigrants | Grenada | 0.0 /100 | #322 | Tragic 17.8% |
| Haitians | 0.0 /100 | #323 | Tragic 17.8% |
| British West Indians | 0.0 /100 | #324 | Tragic 17.9% |
| Immigrants | Haiti | 0.0 /100 | #325 | Tragic 18.2% |
| Cubans | 0.0 /100 | #326 | Tragic 18.2% |
| Apache | 0.0 /100 | #327 | Tragic 18.3% |
| Colville | 0.0 /100 | #328 | Tragic 18.3% |
| Immigrants | Dominica | 0.0 /100 | #329 | Tragic 18.4% |
| Pima | 0.0 /100 | #330 | Tragic 19.0% |
| Immigrants | Caribbean | 0.0 /100 | #331 | Tragic 19.6% |
| Pueblo | 0.0 /100 | #332 | Tragic 19.9% |
| Inupiat | 0.0 /100 | #333 | Tragic 20.1% |
| Yuman | 0.0 /100 | #334 | Tragic 20.2% |
| Immigrants | Cuba | 0.0 /100 | #335 | Tragic 20.8% |
| Navajo | 0.0 /100 | #336 | Tragic 21.1% |
| Cape Verdeans | 0.0 /100 | #337 | Tragic 21.1% |
| Dominicans | 0.0 /100 | #338 | Tragic 21.4% |