Menominee vs Taiwanese Receiving Food Stamps

COMPARE

Menominee
Race
Ancestry
AfghanAfricanAlaska NativeAlaskan AthabascanAlbanianAleutAlsatianAmericanApacheArabArapahoArgentineanArmenianAssyrian/Chaldean/SyriacAustralianAustrianBahamianBangladeshiBarbadianBasqueBelgianBelizeanBermudanBhutaneseBlackfeetBolivianBrazilianBritishBritish West IndianBulgarianBurmeseCajunCambodianCanadianCape VerdeanCarpatho RusynCelticCentral AmericanCentral American IndianCherokeeCheyenneChickasawChileanChineseChippewaChoctawColombianColvilleComancheCosta RicanCreeCreekCroatianCrowCubanCypriotCzechCzechoslovakianDanishDelawareDominicanDutchDutch West IndianEastern EuropeanEcuadorianEgyptianEnglishEstonianEthiopianEuropeanFijianFilipinoFinnishFrenchFrench American IndianFrench CanadianGermanGerman RussianGhanaianGreekGuamanian/ChamorroGuatemalanGuyaneseHaitianHmongHonduranHopiHoumaHungarianIcelanderIndian (Asian)IndonesianInupiatIranianIraqiIrishIroquoisIsraeliItalianJamaicanJapaneseJordanianKenyanKiowaKoreanLaotianLatvianLebaneseLiberianLithuanianLumbeeLuxembourgerMacedonianMalaysianMalteseMarshalleseMenomineeMexicanMexican American IndianMongolianMoroccanNative HawaiianNavajoNepaleseNew ZealanderNicaraguanNigerianNorthern EuropeanNorwegianOkinawanOsageOttawaPaiutePakistaniPalestinianPanamanianParaguayanPennsylvania GermanPeruvianPimaPolishPortuguesePotawatomiPuebloPuerto RicanPuget Sound SalishRomanianRussianSalvadoranSamoanScandinavianScotch-IrishScottishSeminoleSenegaleseSerbianShoshoneSierra LeoneanSiouxSlavicSlovakSloveneSomaliSouth AfricanSouth AmericanSouth American IndianSoviet UnionSpaniardSpanishSpanish AmericanSpanish American IndianSri LankanSubsaharan AfricanSudaneseSwedishSwissSyrianThaiTlingit-HaidaTohono O'OdhamTonganTrinidadian and TobagonianTsimshianTurkishU.S. Virgin IslanderUgandanUkrainianUruguayanUteVenezuelanVietnameseWelshWest IndianYakamaYaquiYugoslavianYumanYup'ikZimbabwean
Immigration
NonimmigrantsImmigrantsAfghanistanAfricaAlbaniaArgentinaArmeniaAsiaAustraliaAustriaBahamasBangladeshBarbadosBelarusBelgiumBelizeBoliviaBosnia and HerzegovinaBrazilBulgariaBurma/MyanmarCabo VerdeCambodiaCameroonCanadaCaribbeanCentral AmericaChileChinaColombiaCongoCosta RicaCroatiaCubaCzechoslovakiaDenmarkDominicaDominican RepublicEastern AfricaEastern AsiaEastern EuropeEcuadorEgyptEl SalvadorEnglandEritreaEthiopiaEuropeFijiFranceGermanyGhanaGreeceGrenadaGuatemalaGuyanaHaitiHondurasHong KongHungaryIndiaIndonesiaIranIraqIrelandIsraelItalyJamaicaJapanJordanKazakhstanKenyaKoreaKuwaitLaosLatin AmericaLatviaLebanonLiberiaLithuaniaMalaysiaMexicoMicronesiaMiddle AfricaMoldovaMoroccoNepalNetherlandsNicaraguaNigeriaNorth AmericaNorth MacedoniaNorthern AfricaNorthern EuropeNorwayOceaniaPakistanPanamaPeruPhilippinesPolandPortugalRomaniaRussiaSaudi ArabiaScotlandSenegalSerbiaSierra LeoneSingaporeSomaliaSouth AfricaSouth AmericaSouth Central AsiaSouth Eastern AsiaSouthern EuropeSpainSri LankaSt. Vincent and the GrenadinesSudanSwedenSwitzerlandSyriaTaiwanThailandTrinidad and TobagoTurkeyUgandaUkraineUruguayUzbekistanVenezuelaVietnamWest IndiesWestern AfricaWestern AsiaWestern EuropeYemenZaireZimbabweAzores
Taiwanese
Race
Ancestry
AfghanAfricanAlaska NativeAlaskan AthabascanAlbanianAleutAlsatianAmericanApacheArabArapahoArgentineanArmenianAssyrian/Chaldean/SyriacAustralianAustrianBahamianBangladeshiBarbadianBasqueBelgianBelizeanBermudanBhutaneseBlackfeetBolivianBrazilianBritishBritish West IndianBulgarianBurmeseCajunCambodianCanadianCape VerdeanCarpatho RusynCelticCentral AmericanCentral American IndianCherokeeCheyenneChickasawChileanChineseChippewaChoctawColombianColvilleComancheCosta RicanCreeCreekCroatianCrowCubanCypriotCzechCzechoslovakianDanishDelawareDominicanDutchDutch West IndianEastern EuropeanEcuadorianEgyptianEnglishEstonianEthiopianEuropeanFijianFilipinoFinnishFrenchFrench American IndianFrench CanadianGermanGerman RussianGhanaianGreekGuamanian/ChamorroGuatemalanGuyaneseHaitianHmongHonduranHopiHoumaHungarianIcelanderIndian (Asian)IndonesianInupiatIranianIraqiIrishIroquoisIsraeliItalianJamaicanJapaneseJordanianKenyanKiowaKoreanLaotianLatvianLebaneseLiberianLithuanianLumbeeLuxembourgerMacedonianMalaysianMalteseMarshalleseMexicanMexican American IndianMongolianMoroccanNative HawaiianNavajoNepaleseNew ZealanderNicaraguanNigerianNorthern EuropeanNorwegianOkinawanOsageOttawaPaiutePakistaniPalestinianPanamanianParaguayanPennsylvania GermanPeruvianPimaPolishPortuguesePotawatomiPuebloPuerto RicanPuget Sound SalishRomanianRussianSalvadoranSamoanScandinavianScotch-IrishScottishSeminoleSenegaleseSerbianShoshoneSierra LeoneanSiouxSlavicSlovakSloveneSomaliSouth AfricanSouth AmericanSouth American IndianSoviet UnionSpaniardSpanishSpanish AmericanSpanish American IndianSri LankanSubsaharan AfricanSudaneseSwedishSwissSyrianTaiwaneseThaiTlingit-HaidaTohono O'OdhamTonganTrinidadian and TobagonianTsimshianTurkishU.S. Virgin IslanderUgandanUkrainianUruguayanUteVenezuelanVietnameseWelshWest IndianYakamaYaquiYugoslavianYumanYup'ikZimbabwean
Immigration
NonimmigrantsImmigrantsAfghanistanAfricaAlbaniaArgentinaArmeniaAsiaAustraliaAustriaBahamasBangladeshBarbadosBelarusBelgiumBelizeBoliviaBosnia and HerzegovinaBrazilBulgariaBurma/MyanmarCabo VerdeCambodiaCameroonCanadaCaribbeanCentral AmericaChileChinaColombiaCongoCosta RicaCroatiaCubaCzechoslovakiaDenmarkDominicaDominican RepublicEastern AfricaEastern AsiaEastern EuropeEcuadorEgyptEl SalvadorEnglandEritreaEthiopiaEuropeFijiFranceGermanyGhanaGreeceGrenadaGuatemalaGuyanaHaitiHondurasHong KongHungaryIndiaIndonesiaIranIraqIrelandIsraelItalyJamaicaJapanJordanKazakhstanKenyaKoreaKuwaitLaosLatin AmericaLatviaLebanonLiberiaLithuaniaMalaysiaMexicoMicronesiaMiddle AfricaMoldovaMoroccoNepalNetherlandsNicaraguaNigeriaNorth AmericaNorth MacedoniaNorthern AfricaNorthern EuropeNorwayOceaniaPakistanPanamaPeruPhilippinesPolandPortugalRomaniaRussiaSaudi ArabiaScotlandSenegalSerbiaSierra LeoneSingaporeSomaliaSouth AfricaSouth AmericaSouth Central AsiaSouth Eastern AsiaSouthern EuropeSpainSri LankaSt. Vincent and the GrenadinesSudanSwedenSwitzerlandSyriaTaiwanThailandTrinidad and TobagoTurkeyUgandaUkraineUruguayUzbekistanVenezuelaVietnamWest IndiesWestern AfricaWestern AsiaWestern EuropeYemenZaireZimbabweAzores
Receiving Food Stamps
Income
Poverty
Unemployment
Labor Participation
Family Structure
Vehicle Availability
Education Level
Disability

Receiving Food Stamps Comparison

Menominee

Taiwanese

Tragic
Excellent
17.2%
RECEIVING FOOD STAMPS
0.0/ 100
METRIC RATING
318th/ 347
METRIC RANK
11.0%
RECEIVING FOOD STAMPS
84.2/ 100
METRIC RATING
146th/ 347
METRIC RANK

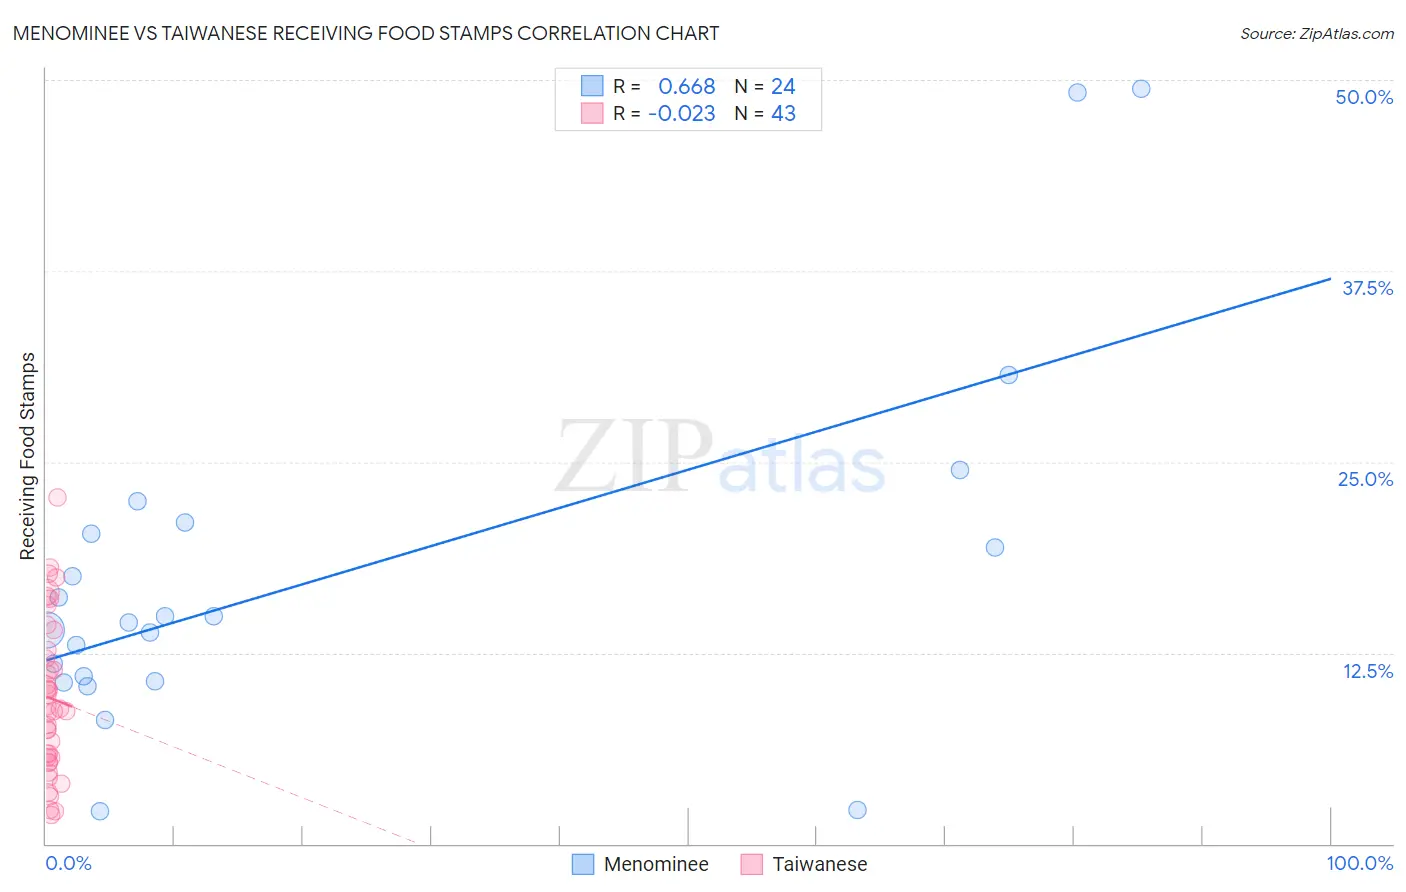
Menominee vs Taiwanese Receiving Food Stamps Correlation Chart

The statistical analysis conducted on geographies consisting of 45,777,260 people shows a significant positive correlation between the proportion of Menominee and percentage of population receiving government assistance and/or food stamps in the United States with a correlation coefficient (R) of 0.668 and weighted average of 17.2%. Similarly, the statistical analysis conducted on geographies consisting of 31,675,875 people shows no correlation between the proportion of Taiwanese and percentage of population receiving government assistance and/or food stamps in the United States with a correlation coefficient (R) of -0.023 and weighted average of 11.0%, a difference of 55.6%.
Menominee vs Taiwanese Receiving Food Stamps

Receiving Food Stamps Correlation Summary

MeasurementMenomineeTaiwanese
Minimum2.1%1.9%
Maximum49.4%22.7%
Range47.3%20.8%
Mean17.6%9.5%
Median14.7%8.8%
Interquartile 25% (IQ1)10.8%5.6%
Interquartile 75% (IQ3)20.7%12.7%
Interquartile Range (IQR)9.9%7.1%
Standard Deviation (Sample)11.7%5.0%
Standard Deviation (Population)11.4%5.0%

Similar Demographics by Receiving Food Stamps

Demographics Similar to Menominee by Receiving Food Stamps

In terms of receiving food stamps, the demographic groups most similar to Menominee are Black/African American (17.2%, a difference of 0.17%), Immigrants from St. Vincent and the Grenadines (17.2%, a difference of 0.18%), Immigrants from Nicaragua (17.2%, a difference of 0.26%), Native/Alaskan (17.3%, a difference of 0.44%), and Central American Indian (17.1%, a difference of 0.70%).
DemographicsRating | RankReceiving Food Stamps
Guyanese
0.0
/100
|
#311
Tragic
16.7%
Sioux
0.0
/100
|
#312
Tragic
16.8%
Immigrants | Jamaica
0.0
/100
|
#313
Tragic
16.9%
Immigrants | Guyana
0.0
/100
|
#314
Tragic
16.9%
Bahamians
0.0
/100
|
#315
Tragic
17.0%
Central American Indians
0.0
/100
|
#316
Tragic
17.1%
Blacks/African Americans
0.0
/100
|
#317
Tragic
17.2%
Menominee
0.0
/100
|
#318
Tragic
17.2%
Immigrants | St. Vincent and the Grenadines
0.0
/100
|
#319
Tragic
17.2%
Immigrants | Nicaragua
0.0
/100
|
#320
Tragic
17.2%
Natives/Alaskans
0.0
/100
|
#321
Tragic
17.3%
Immigrants | Grenada
0.0
/100
|
#322
Tragic
17.8%
Haitians
0.0
/100
|
#323
Tragic
17.8%
British West Indians
0.0
/100
|
#324
Tragic
17.9%
Immigrants | Haiti
0.0
/100
|
#325
Tragic
18.2%

Demographics Similar to Taiwanese by Receiving Food Stamps

In terms of receiving food stamps, the demographic groups most similar to Taiwanese are White/Caucasian (11.1%, a difference of 0.090%), Hungarian (11.0%, a difference of 0.24%), Immigrants from South Eastern Asia (11.1%, a difference of 0.26%), Brazilian (11.1%, a difference of 0.28%), and Soviet Union (11.1%, a difference of 0.30%).
DemographicsRating | RankReceiving Food Stamps
Hmong
88.4
/100
|
#139
Excellent
10.9%
Celtics
87.8
/100
|
#140
Excellent
10.9%
Immigrants | Vietnam
86.7
/100
|
#141
Excellent
11.0%
Chileans
86.2
/100
|
#142
Excellent
11.0%
Immigrants | Northern Africa
86.0
/100
|
#143
Excellent
11.0%
Syrians
85.5
/100
|
#144
Excellent
11.0%
Hungarians
85.1
/100
|
#145
Excellent
11.0%
Taiwanese
84.2
/100
|
#146
Excellent
11.0%
Whites/Caucasians
83.9
/100
|
#147
Excellent
11.1%
Immigrants | South Eastern Asia
83.3
/100
|
#148
Excellent
11.1%
Brazilians
83.2
/100
|
#149
Excellent
11.1%
Soviet Union
83.1
/100
|
#150
Excellent
11.1%
Immigrants | Spain
81.7
/100
|
#151
Excellent
11.1%
Immigrants | Kazakhstan
81.7
/100
|
#152
Excellent
11.1%
Lebanese
81.6
/100
|
#153
Excellent
11.1%