Menominee vs Lumbee Per Capita Income
COMPARE
Menominee
Lumbee
Per Capita Income
Per Capita Income Comparison
Menominee
Lumbee
$34,578
PER CAPITA INCOME
0.0/ 100
METRIC RATING
328th/ 347
METRIC RANK
$29,845
PER CAPITA INCOME
0.0/ 100
METRIC RATING
346th/ 347
METRIC RANK
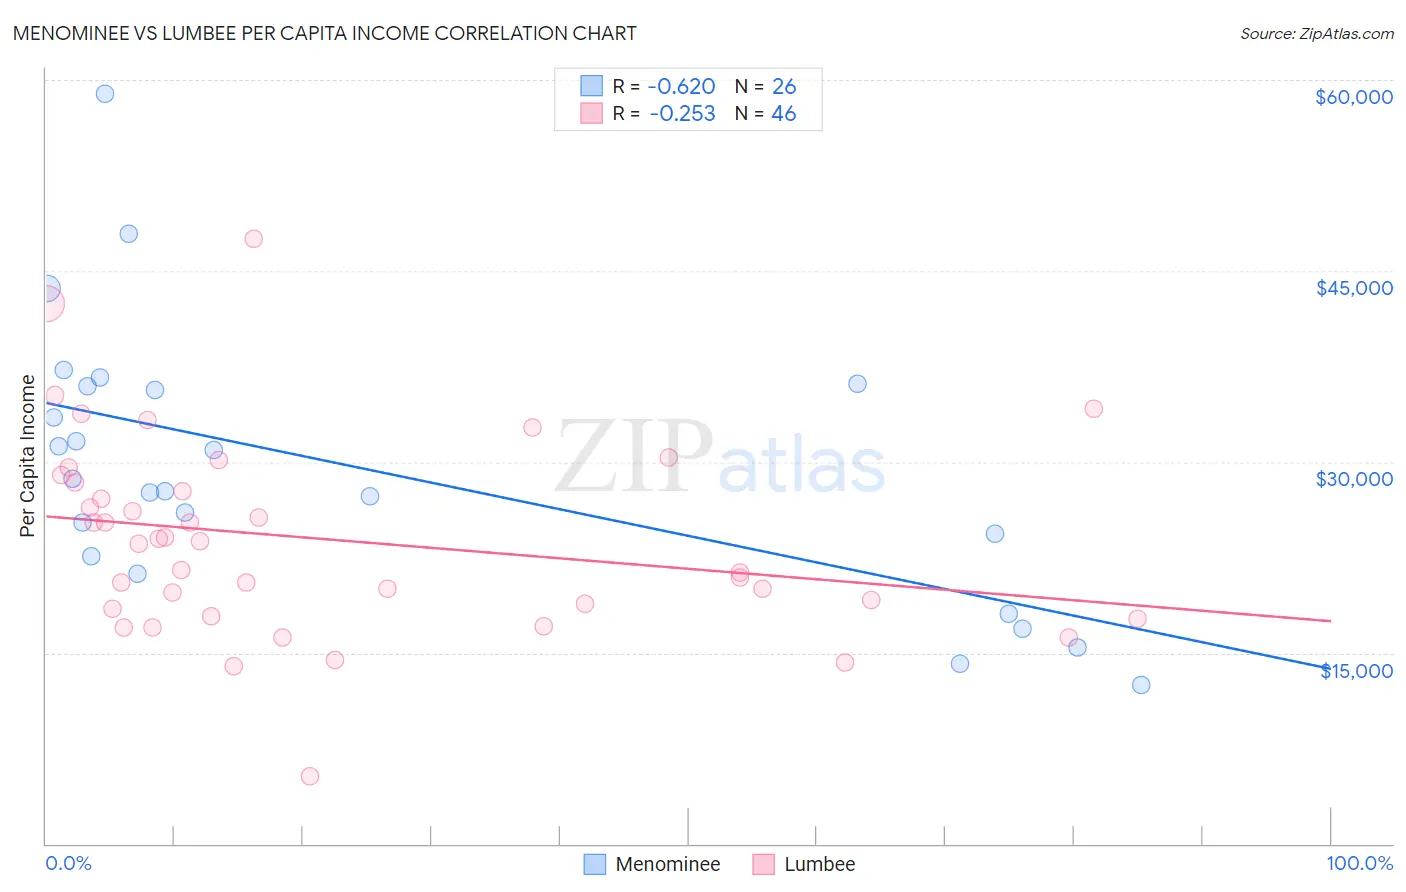
Menominee vs Lumbee Per Capita Income Correlation Chart
The statistical analysis conducted on geographies consisting of 45,778,979 people shows a significant negative correlation between the proportion of Menominee and per capita income in the United States with a correlation coefficient (R) of -0.620 and weighted average of $34,578. Similarly, the statistical analysis conducted on geographies consisting of 92,299,068 people shows a weak negative correlation between the proportion of Lumbee and per capita income in the United States with a correlation coefficient (R) of -0.253 and weighted average of $29,845, a difference of 15.9%.
Per Capita Income Correlation Summary
| Measurement | Menominee | Lumbee |
| Minimum | $12,454 | $5,266 |
| Maximum | $58,872 | $47,547 |
| Range | $46,418 | $42,281 |
| Mean | $29,500 | $23,880 |
| Median | $28,225 | $23,634 |
| Interquartile 25% (IQ1) | $22,568 | $18,484 |
| Interquartile 75% (IQ3) | $35,908 | $28,340 |
| Interquartile Range (IQR) | $13,340 | $9,856 |
| Standard Deviation (Sample) | $10,696 | $7,789 |
| Standard Deviation (Population) | $10,488 | $7,704 |
Demographics Similar to Menominee and Lumbee by Per Capita Income
In terms of per capita income, the demographic groups most similar to Menominee are Mexican ($34,559, a difference of 0.060%), Apache ($34,886, a difference of 0.89%), Spanish American Indian ($34,195, a difference of 1.1%), Immigrants from Mexico ($33,931, a difference of 1.9%), and Sioux ($33,921, a difference of 1.9%). Similarly, the demographic groups most similar to Lumbee are Tohono O'odham ($30,256, a difference of 1.4%), Yup'ik ($30,518, a difference of 2.3%), Pima ($30,644, a difference of 2.7%), Navajo ($29,031, a difference of 2.8%), and Hopi ($31,177, a difference of 4.5%).
| Demographics | Rating | Rank | Per Capita Income |
| Apache | 0.0 /100 | #327 | Tragic $34,886 |
| Menominee | 0.0 /100 | #328 | Tragic $34,578 |
| Mexicans | 0.0 /100 | #329 | Tragic $34,559 |
| Spanish American Indians | 0.0 /100 | #330 | Tragic $34,195 |
| Immigrants | Mexico | 0.0 /100 | #331 | Tragic $33,931 |
| Sioux | 0.0 /100 | #332 | Tragic $33,921 |
| Immigrants | Yemen | 0.0 /100 | #333 | Tragic $33,696 |
| Natives/Alaskans | 0.0 /100 | #334 | Tragic $33,279 |
| Yuman | 0.0 /100 | #335 | Tragic $33,236 |
| Yakama | 0.0 /100 | #336 | Tragic $33,009 |
| Houma | 0.0 /100 | #337 | Tragic $32,996 |
| Arapaho | 0.0 /100 | #338 | Tragic $32,345 |
| Pueblo | 0.0 /100 | #339 | Tragic $32,012 |
| Crow | 0.0 /100 | #340 | Tragic $31,729 |
| Puerto Ricans | 0.0 /100 | #341 | Tragic $31,268 |
| Hopi | 0.0 /100 | #342 | Tragic $31,177 |
| Pima | 0.0 /100 | #343 | Tragic $30,644 |
| Yup'ik | 0.0 /100 | #344 | Tragic $30,518 |
| Tohono O'odham | 0.0 /100 | #345 | Tragic $30,256 |
| Lumbee | 0.0 /100 | #346 | Tragic $29,845 |
| Navajo | 0.0 /100 | #347 | Tragic $29,031 |