Menominee vs Immigrants from Latin America Receiving Food Stamps
COMPARE
Menominee
Immigrants from Latin America
Receiving Food Stamps
Receiving Food Stamps Comparison
Menominee
Immigrants from Latin America
17.2%
RECEIVING FOOD STAMPS
0.0/ 100
METRIC RATING
318th/ 347
METRIC RANK
15.7%
RECEIVING FOOD STAMPS
0.0/ 100
METRIC RATING
294th/ 347
METRIC RANK
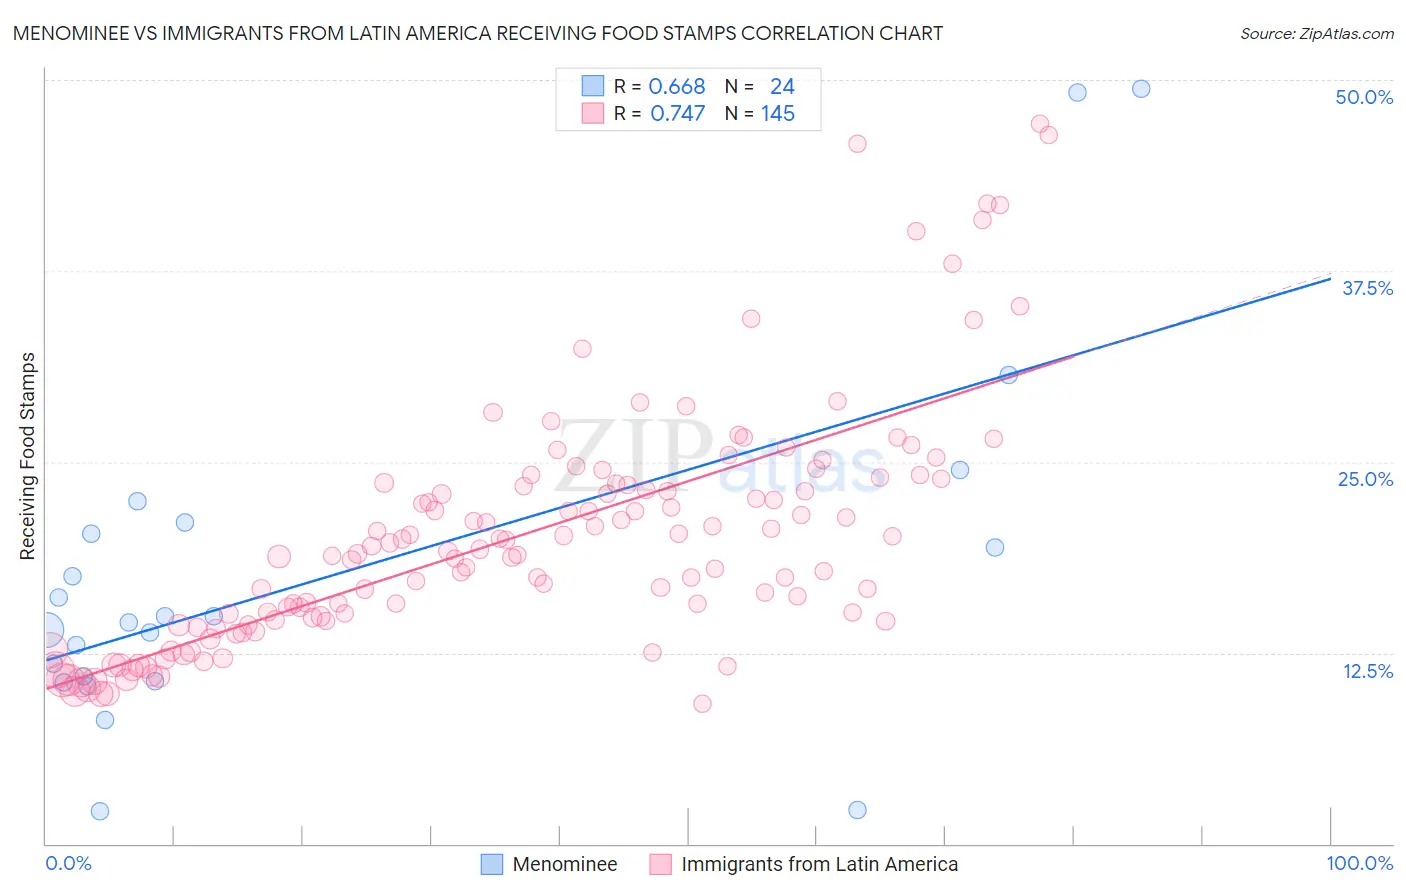
Menominee vs Immigrants from Latin America Receiving Food Stamps Correlation Chart
The statistical analysis conducted on geographies consisting of 45,777,260 people shows a significant positive correlation between the proportion of Menominee and percentage of population receiving government assistance and/or food stamps in the United States with a correlation coefficient (R) of 0.668 and weighted average of 17.2%. Similarly, the statistical analysis conducted on geographies consisting of 555,568,620 people shows a strong positive correlation between the proportion of Immigrants from Latin America and percentage of population receiving government assistance and/or food stamps in the United States with a correlation coefficient (R) of 0.747 and weighted average of 15.7%, a difference of 9.7%.
Receiving Food Stamps Correlation Summary
| Measurement | Menominee | Immigrants from Latin America |
| Minimum | 2.1% | 9.2% |
| Maximum | 49.4% | 47.1% |
| Range | 47.3% | 37.9% |
| Mean | 17.6% | 20.1% |
| Median | 14.7% | 19.0% |
| Interquartile 25% (IQ1) | 10.8% | 14.6% |
| Interquartile 75% (IQ3) | 20.7% | 23.5% |
| Interquartile Range (IQR) | 9.9% | 9.0% |
| Standard Deviation (Sample) | 11.7% | 7.9% |
| Standard Deviation (Population) | 11.4% | 7.8% |
Similar Demographics by Receiving Food Stamps
Demographics Similar to Menominee by Receiving Food Stamps
In terms of receiving food stamps, the demographic groups most similar to Menominee are Black/African American (17.2%, a difference of 0.17%), Immigrants from St. Vincent and the Grenadines (17.2%, a difference of 0.18%), Immigrants from Nicaragua (17.2%, a difference of 0.26%), Native/Alaskan (17.3%, a difference of 0.44%), and Central American Indian (17.1%, a difference of 0.70%).
| Demographics | Rating | Rank | Receiving Food Stamps |
| Guyanese | 0.0 /100 | #311 | Tragic 16.7% |
| Sioux | 0.0 /100 | #312 | Tragic 16.8% |
| Immigrants | Jamaica | 0.0 /100 | #313 | Tragic 16.9% |
| Immigrants | Guyana | 0.0 /100 | #314 | Tragic 16.9% |
| Bahamians | 0.0 /100 | #315 | Tragic 17.0% |
| Central American Indians | 0.0 /100 | #316 | Tragic 17.1% |
| Blacks/African Americans | 0.0 /100 | #317 | Tragic 17.2% |
| Menominee | 0.0 /100 | #318 | Tragic 17.2% |
| Immigrants | St. Vincent and the Grenadines | 0.0 /100 | #319 | Tragic 17.2% |
| Immigrants | Nicaragua | 0.0 /100 | #320 | Tragic 17.2% |
| Natives/Alaskans | 0.0 /100 | #321 | Tragic 17.3% |
| Immigrants | Grenada | 0.0 /100 | #322 | Tragic 17.8% |
| Haitians | 0.0 /100 | #323 | Tragic 17.8% |
| British West Indians | 0.0 /100 | #324 | Tragic 17.9% |
| Immigrants | Haiti | 0.0 /100 | #325 | Tragic 18.2% |
Demographics Similar to Immigrants from Latin America by Receiving Food Stamps
In terms of receiving food stamps, the demographic groups most similar to Immigrants from Latin America are Vietnamese (15.7%, a difference of 0.11%), Immigrants from Honduras (15.7%, a difference of 0.32%), Tsimshian (15.7%, a difference of 0.33%), Alaska Native (15.6%, a difference of 0.41%), and Immigrants from Bahamas (15.8%, a difference of 0.49%).
| Demographics | Rating | Rank | Receiving Food Stamps |
| Immigrants | Mexico | 0.0 /100 | #287 | Tragic 15.2% |
| Immigrants | Belize | 0.0 /100 | #288 | Tragic 15.2% |
| Immigrants | Senegal | 0.0 /100 | #289 | Tragic 15.3% |
| Senegalese | 0.0 /100 | #290 | Tragic 15.4% |
| Hondurans | 0.0 /100 | #291 | Tragic 15.5% |
| Alaska Natives | 0.0 /100 | #292 | Tragic 15.6% |
| Vietnamese | 0.0 /100 | #293 | Tragic 15.7% |
| Immigrants | Latin America | 0.0 /100 | #294 | Tragic 15.7% |
| Immigrants | Honduras | 0.0 /100 | #295 | Tragic 15.7% |
| Tsimshian | 0.0 /100 | #296 | Tragic 15.7% |
| Immigrants | Bahamas | 0.0 /100 | #297 | Tragic 15.8% |
| Immigrants | Trinidad and Tobago | 0.0 /100 | #298 | Tragic 15.8% |
| Hispanics or Latinos | 0.0 /100 | #299 | Tragic 15.8% |
| Immigrants | Bangladesh | 0.0 /100 | #300 | Tragic 15.9% |
| Trinidadians and Tobagonians | 0.0 /100 | #301 | Tragic 16.0% |