Bangladeshi vs Immigrants from Venezuela Single Mother Poverty
COMPARE
Bangladeshi
Immigrants from Venezuela
Single Mother Poverty
Single Mother Poverty Comparison
Bangladeshis
Immigrants from Venezuela
31.7%
SINGLE MOTHER POVERTY
0.1/ 100
METRIC RATING
274th/ 347
METRIC RANK
28.1%
SINGLE MOTHER POVERTY
95.8/ 100
METRIC RATING
107th/ 347
METRIC RANK
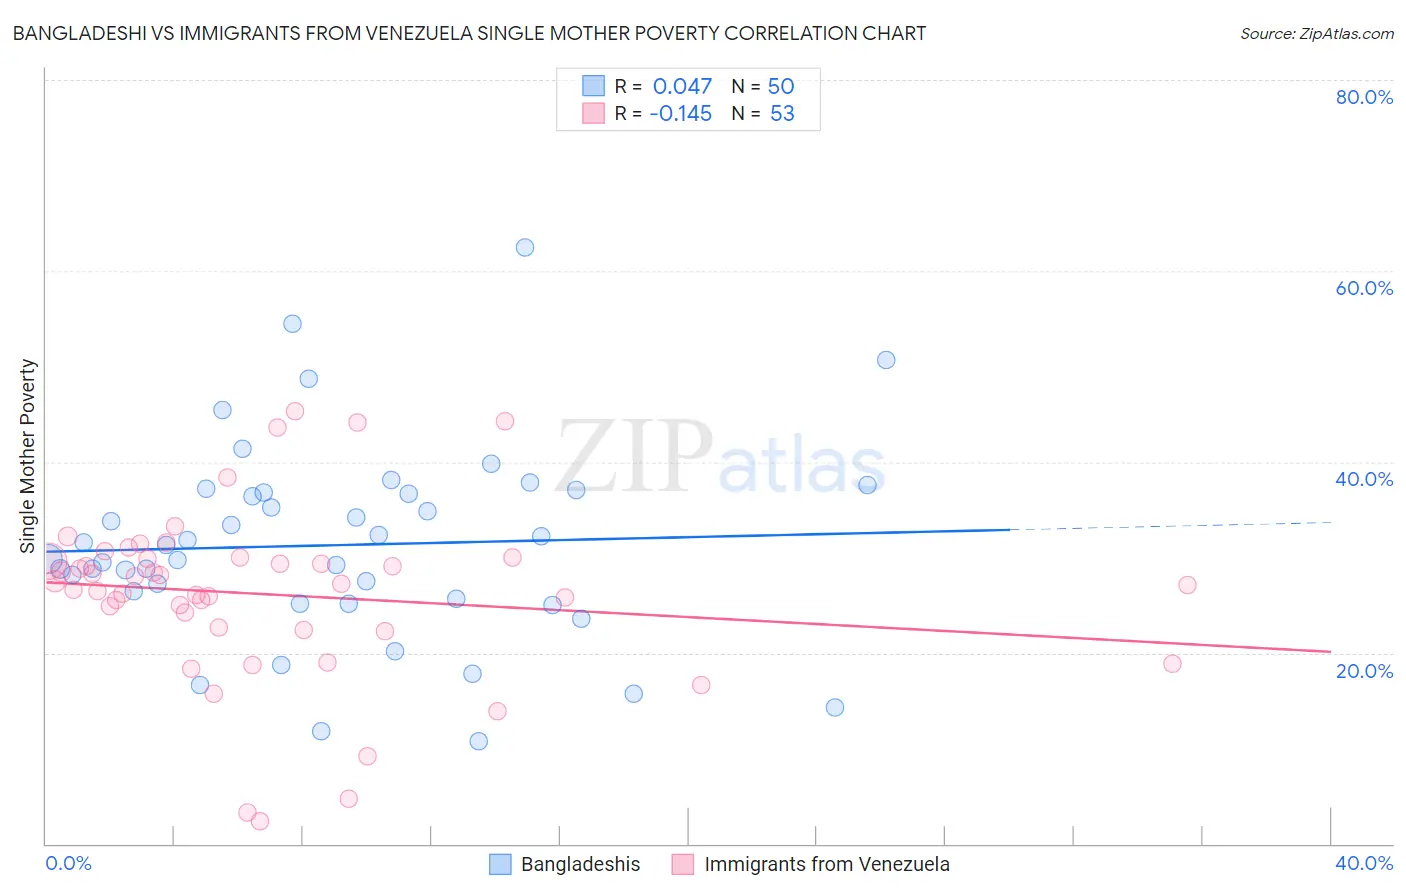
Bangladeshi vs Immigrants from Venezuela Single Mother Poverty Correlation Chart
The statistical analysis conducted on geographies consisting of 140,162,817 people shows no correlation between the proportion of Bangladeshis and poverty level among single mothers in the United States with a correlation coefficient (R) of 0.047 and weighted average of 31.7%. Similarly, the statistical analysis conducted on geographies consisting of 283,418,306 people shows a poor negative correlation between the proportion of Immigrants from Venezuela and poverty level among single mothers in the United States with a correlation coefficient (R) of -0.145 and weighted average of 28.1%, a difference of 13.0%.
Single Mother Poverty Correlation Summary
| Measurement | Bangladeshi | Immigrants from Venezuela |
| Minimum | 10.8% | 2.4% |
| Maximum | 62.5% | 45.4% |
| Range | 51.7% | 43.0% |
| Mean | 31.3% | 26.1% |
| Median | 30.5% | 27.3% |
| Interquartile 25% (IQ1) | 25.7% | 22.5% |
| Interquartile 75% (IQ3) | 36.8% | 29.9% |
| Interquartile Range (IQR) | 11.1% | 7.4% |
| Standard Deviation (Sample) | 10.3% | 9.0% |
| Standard Deviation (Population) | 10.2% | 9.0% |
Similar Demographics by Single Mother Poverty
Demographics Similar to Bangladeshis by Single Mother Poverty
In terms of single mother poverty, the demographic groups most similar to Bangladeshis are Central American (31.8%, a difference of 0.19%), Fijian (31.6%, a difference of 0.23%), Delaware (31.8%, a difference of 0.35%), Immigrants from Micronesia (31.6%, a difference of 0.46%), and Immigrants from Cabo Verde (31.6%, a difference of 0.48%).
| Demographics | Rating | Rank | Single Mother Poverty |
| Immigrants | Belize | 0.2 /100 | #267 | Tragic 31.4% |
| Immigrants | Senegal | 0.1 /100 | #268 | Tragic 31.5% |
| Scotch-Irish | 0.1 /100 | #269 | Tragic 31.5% |
| British West Indians | 0.1 /100 | #270 | Tragic 31.5% |
| Immigrants | Cabo Verde | 0.1 /100 | #271 | Tragic 31.6% |
| Immigrants | Micronesia | 0.1 /100 | #272 | Tragic 31.6% |
| Fijians | 0.1 /100 | #273 | Tragic 31.6% |
| Bangladeshis | 0.1 /100 | #274 | Tragic 31.7% |
| Central Americans | 0.1 /100 | #275 | Tragic 31.8% |
| Delaware | 0.0 /100 | #276 | Tragic 31.8% |
| Mexican American Indians | 0.0 /100 | #277 | Tragic 31.9% |
| Immigrants | Zaire | 0.0 /100 | #278 | Tragic 32.0% |
| Marshallese | 0.0 /100 | #279 | Tragic 32.1% |
| Immigrants | Nonimmigrants | 0.0 /100 | #280 | Tragic 32.2% |
| Cree | 0.0 /100 | #281 | Tragic 32.2% |
Demographics Similar to Immigrants from Venezuela by Single Mother Poverty
In terms of single mother poverty, the demographic groups most similar to Immigrants from Venezuela are Immigrants from Zimbabwe (28.1%, a difference of 0.080%), Immigrants from Armenia (28.1%, a difference of 0.17%), Ukrainian (28.0%, a difference of 0.21%), Israeli (28.0%, a difference of 0.25%), and Italian (28.0%, a difference of 0.28%).
| Demographics | Rating | Rank | Single Mother Poverty |
| Zimbabweans | 97.1 /100 | #100 | Exceptional 27.9% |
| Pakistanis | 96.9 /100 | #101 | Exceptional 28.0% |
| Immigrants | Croatia | 96.7 /100 | #102 | Exceptional 28.0% |
| Immigrants | Northern Africa | 96.6 /100 | #103 | Exceptional 28.0% |
| Italians | 96.6 /100 | #104 | Exceptional 28.0% |
| Israelis | 96.5 /100 | #105 | Exceptional 28.0% |
| Ukrainians | 96.4 /100 | #106 | Exceptional 28.0% |
| Immigrants | Venezuela | 95.8 /100 | #107 | Exceptional 28.1% |
| Immigrants | Zimbabwe | 95.5 /100 | #108 | Exceptional 28.1% |
| Immigrants | Armenia | 95.2 /100 | #109 | Exceptional 28.1% |
| Croatians | 94.8 /100 | #110 | Exceptional 28.2% |
| Venezuelans | 94.5 /100 | #111 | Exceptional 28.2% |
| Immigrants | Kazakhstan | 94.5 /100 | #112 | Exceptional 28.2% |
| Immigrants | South Africa | 93.2 /100 | #113 | Exceptional 28.3% |
| Immigrants | Western Asia | 92.7 /100 | #114 | Exceptional 28.3% |