Menominee vs Senegalese Single Male Poverty
COMPARE
Menominee
Senegalese
Single Male Poverty
Single Male Poverty Comparison
Menominee
Senegalese
17.7%
SINGLE MALE POVERTY
0.0/ 100
METRIC RATING
327th/ 347
METRIC RANK
13.1%
SINGLE MALE POVERTY
16.4/ 100
METRIC RATING
212th/ 347
METRIC RANK
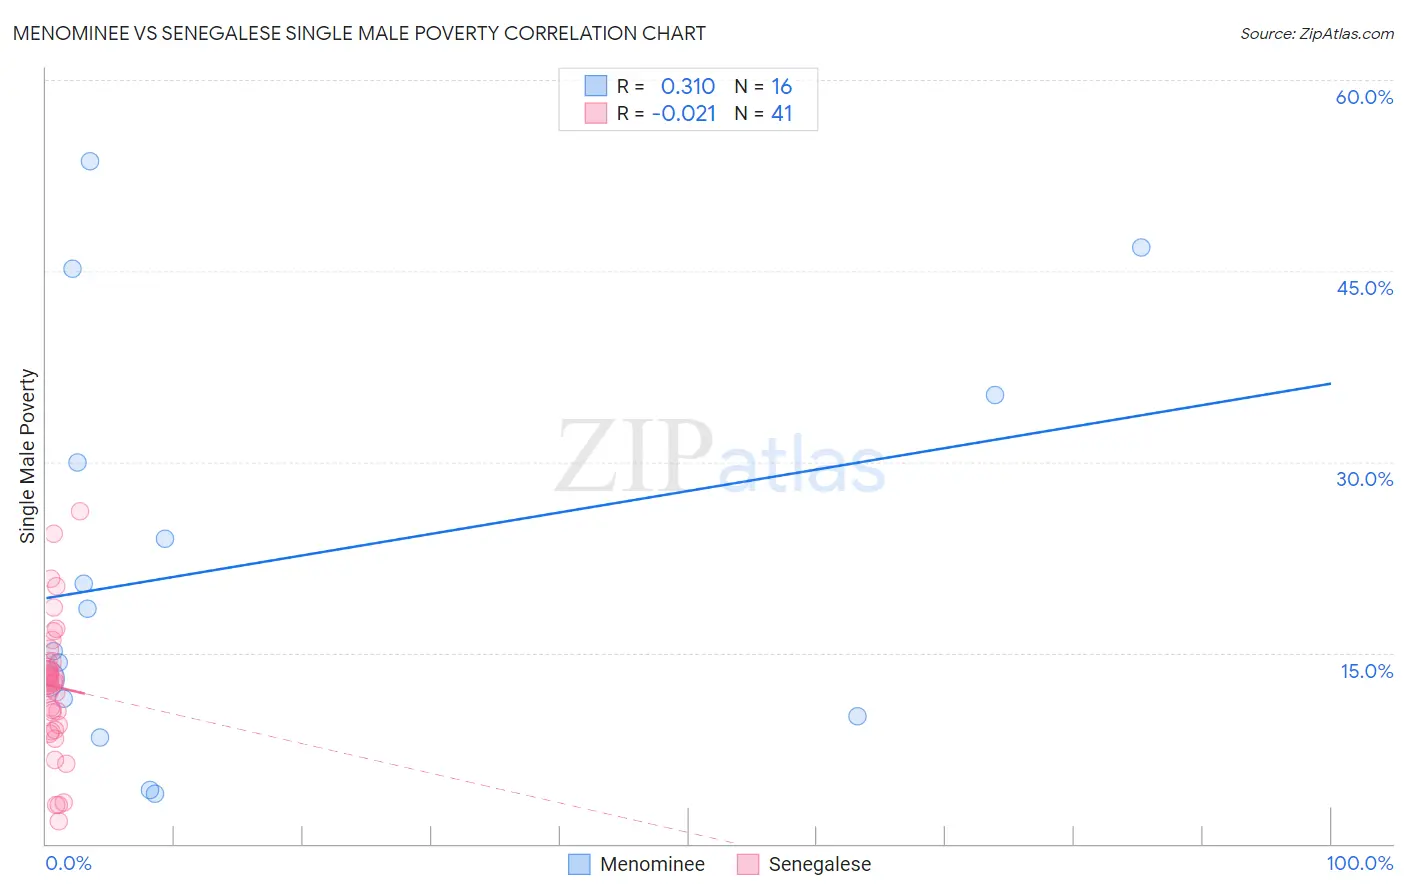
Menominee vs Senegalese Single Male Poverty Correlation Chart
The statistical analysis conducted on geographies consisting of 44,140,338 people shows a mild positive correlation between the proportion of Menominee and poverty level among single males in the United States with a correlation coefficient (R) of 0.310 and weighted average of 17.7%. Similarly, the statistical analysis conducted on geographies consisting of 76,027,863 people shows no correlation between the proportion of Senegalese and poverty level among single males in the United States with a correlation coefficient (R) of -0.021 and weighted average of 13.1%, a difference of 35.5%.
Single Male Poverty Correlation Summary
| Measurement | Menominee | Senegalese |
| Minimum | 3.9% | 1.8% |
| Maximum | 53.7% | 26.2% |
| Range | 49.8% | 24.4% |
| Mean | 22.1% | 12.4% |
| Median | 16.8% | 12.7% |
| Interquartile 25% (IQ1) | 10.7% | 9.1% |
| Interquartile 75% (IQ3) | 32.6% | 14.3% |
| Interquartile Range (IQR) | 22.0% | 5.2% |
| Standard Deviation (Sample) | 15.7% | 5.2% |
| Standard Deviation (Population) | 15.2% | 5.2% |
Similar Demographics by Single Male Poverty
Demographics Similar to Menominee by Single Male Poverty
In terms of single male poverty, the demographic groups most similar to Menominee are Central American Indian (17.2%, a difference of 2.7%), Kiowa (18.3%, a difference of 3.3%), Colville (18.4%, a difference of 4.0%), Choctaw (17.0%, a difference of 4.3%), and Immigrants from Yemen (16.9%, a difference of 5.1%).
| Demographics | Rating | Rank | Single Male Poverty |
| Marshallese | 0.0 /100 | #320 | Tragic 16.4% |
| Osage | 0.0 /100 | #321 | Tragic 16.5% |
| Shoshone | 0.0 /100 | #322 | Tragic 16.7% |
| Creek | 0.0 /100 | #323 | Tragic 16.8% |
| Immigrants | Yemen | 0.0 /100 | #324 | Tragic 16.9% |
| Choctaw | 0.0 /100 | #325 | Tragic 17.0% |
| Central American Indians | 0.0 /100 | #326 | Tragic 17.2% |
| Menominee | 0.0 /100 | #327 | Tragic 17.7% |
| Kiowa | 0.0 /100 | #328 | Tragic 18.3% |
| Colville | 0.0 /100 | #329 | Tragic 18.4% |
| Cajuns | 0.0 /100 | #330 | Tragic 19.1% |
| Paiute | 0.0 /100 | #331 | Tragic 19.3% |
| Natives/Alaskans | 0.0 /100 | #332 | Tragic 19.6% |
| Inupiat | 0.0 /100 | #333 | Tragic 20.0% |
| Pima | 0.0 /100 | #334 | Tragic 20.2% |
Demographics Similar to Senegalese by Single Male Poverty
In terms of single male poverty, the demographic groups most similar to Senegalese are Swedish (13.1%, a difference of 0.030%), Immigrants from Haiti (13.1%, a difference of 0.040%), Italian (13.1%, a difference of 0.050%), Mexican American Indian (13.1%, a difference of 0.10%), and Immigrants from Western Africa (13.1%, a difference of 0.11%).
| Demographics | Rating | Rank | Single Male Poverty |
| Poles | 19.3 /100 | #205 | Poor 13.0% |
| Northern Europeans | 18.9 /100 | #206 | Poor 13.0% |
| Sudanese | 17.7 /100 | #207 | Poor 13.1% |
| Immigrants | Western Africa | 17.6 /100 | #208 | Poor 13.1% |
| Mexican American Indians | 17.5 /100 | #209 | Poor 13.1% |
| Immigrants | Haiti | 16.8 /100 | #210 | Poor 13.1% |
| Swedes | 16.8 /100 | #211 | Poor 13.1% |
| Senegalese | 16.4 /100 | #212 | Poor 13.1% |
| Italians | 15.9 /100 | #213 | Poor 13.1% |
| Zimbabweans | 14.9 /100 | #214 | Poor 13.1% |
| Japanese | 14.8 /100 | #215 | Poor 13.1% |
| Austrians | 13.9 /100 | #216 | Poor 13.1% |
| Bermudans | 13.0 /100 | #217 | Poor 13.1% |
| Scandinavians | 12.9 /100 | #218 | Poor 13.1% |
| Immigrants | Burma/Myanmar | 12.6 /100 | #219 | Poor 13.1% |