Menominee vs Immigrants from Nepal Nursery School
COMPARE
Menominee
Immigrants from Nepal
Nursery School
Nursery School Comparison
Menominee
Immigrants from Nepal
98.2%
NURSERY SCHOOL
93.6/ 100
METRIC RATING
126th/ 347
METRIC RANK
97.7%
NURSERY SCHOOL
3.6/ 100
METRIC RATING
224th/ 347
METRIC RANK
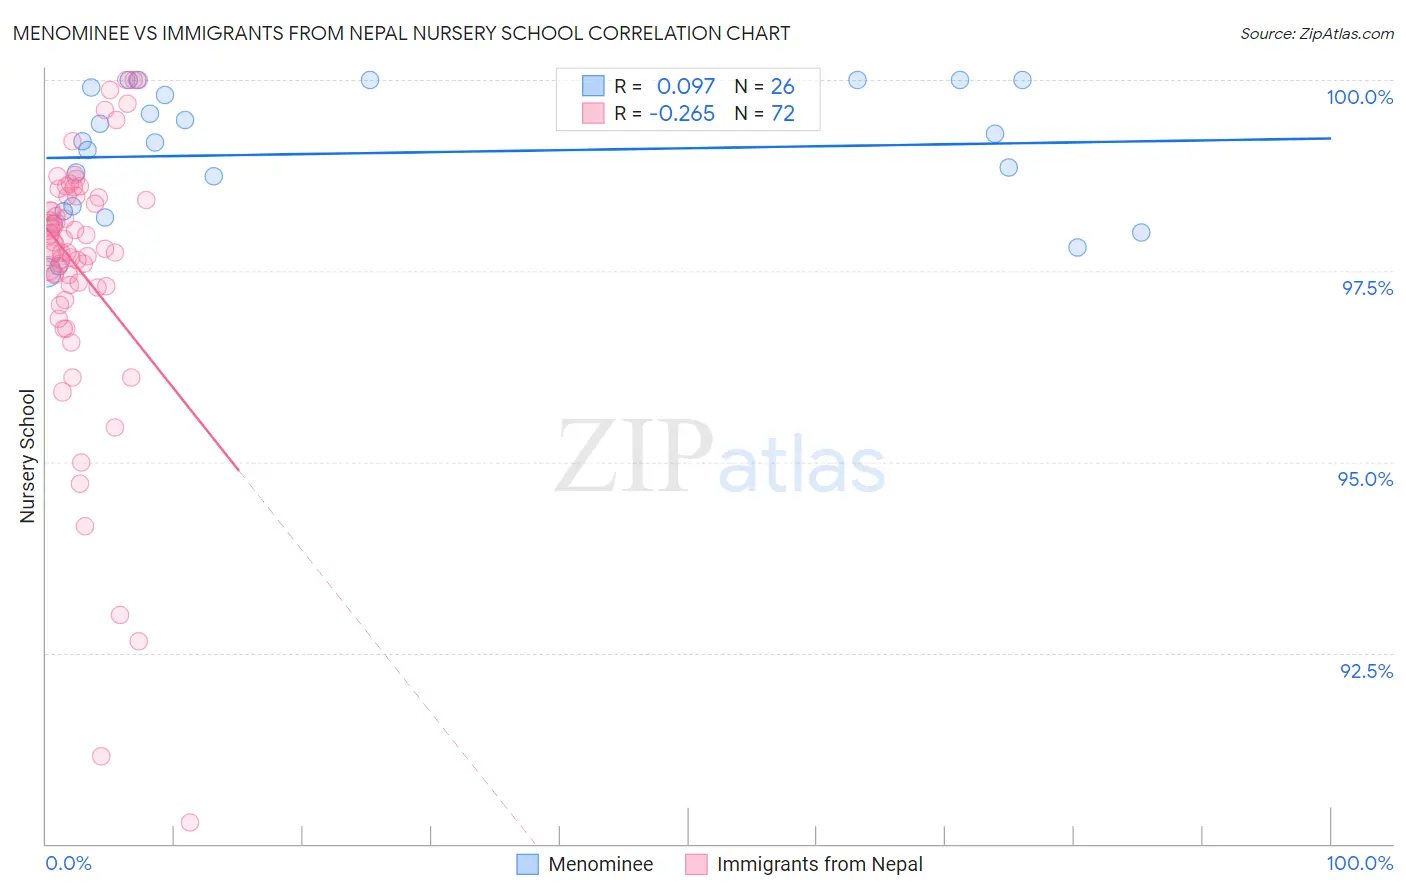
Menominee vs Immigrants from Nepal Nursery School Correlation Chart
The statistical analysis conducted on geographies consisting of 45,778,979 people shows a slight positive correlation between the proportion of Menominee and percentage of population with at least nursery school education in the United States with a correlation coefficient (R) of 0.097 and weighted average of 98.2%. Similarly, the statistical analysis conducted on geographies consisting of 186,766,254 people shows a weak negative correlation between the proportion of Immigrants from Nepal and percentage of population with at least nursery school education in the United States with a correlation coefficient (R) of -0.265 and weighted average of 97.7%, a difference of 0.45%.
Nursery School Correlation Summary
| Measurement | Menominee | Immigrants from Nepal |
| Minimum | 97.5% | 90.3% |
| Maximum | 100.0% | 100.0% |
| Range | 2.5% | 9.7% |
| Mean | 99.0% | 97.5% |
| Median | 99.2% | 97.8% |
| Interquartile 25% (IQ1) | 98.3% | 97.3% |
| Interquartile 75% (IQ3) | 99.9% | 98.5% |
| Interquartile Range (IQR) | 1.6% | 1.2% |
| Standard Deviation (Sample) | 0.84% | 1.8% |
| Standard Deviation (Population) | 0.82% | 1.8% |
Similar Demographics by Nursery School
Demographics Similar to Menominee by Nursery School
In terms of nursery school, the demographic groups most similar to Menominee are Syrian (98.2%, a difference of 0.0%), Lebanese (98.2%, a difference of 0.0%), Iroquois (98.2%, a difference of 0.0%), Immigrants from Saudi Arabia (98.2%, a difference of 0.0%), and Okinawan (98.2%, a difference of 0.010%).
| Demographics | Rating | Rank | Nursery School |
| Thais | 95.0 /100 | #119 | Exceptional 98.2% |
| Okinawans | 94.5 /100 | #120 | Exceptional 98.2% |
| Immigrants | Zimbabwe | 94.2 /100 | #121 | Exceptional 98.2% |
| Immigrants | Japan | 94.0 /100 | #122 | Exceptional 98.2% |
| Syrians | 93.9 /100 | #123 | Exceptional 98.2% |
| Lebanese | 93.8 /100 | #124 | Exceptional 98.2% |
| Iroquois | 93.7 /100 | #125 | Exceptional 98.2% |
| Menominee | 93.6 /100 | #126 | Exceptional 98.2% |
| Immigrants | Saudi Arabia | 93.4 /100 | #127 | Exceptional 98.2% |
| Immigrants | Serbia | 92.4 /100 | #128 | Exceptional 98.2% |
| Cambodians | 91.4 /100 | #129 | Exceptional 98.2% |
| Immigrants | Croatia | 91.4 /100 | #130 | Exceptional 98.2% |
| Spaniards | 91.1 /100 | #131 | Exceptional 98.2% |
| Seminole | 90.9 /100 | #132 | Exceptional 98.2% |
| Immigrants | Europe | 90.7 /100 | #133 | Exceptional 98.1% |
Demographics Similar to Immigrants from Nepal by Nursery School
In terms of nursery school, the demographic groups most similar to Immigrants from Nepal are Immigrants from Costa Rica (97.7%, a difference of 0.0%), Iraqi (97.7%, a difference of 0.0%), Immigrants from Zaire (97.8%, a difference of 0.010%), Tongan (97.8%, a difference of 0.010%), and Immigrants from Syria (97.7%, a difference of 0.010%).
| Demographics | Rating | Rank | Nursery School |
| Samoans | 6.3 /100 | #217 | Tragic 97.8% |
| Immigrants | Panama | 5.3 /100 | #218 | Tragic 97.8% |
| Immigrants | Morocco | 5.1 /100 | #219 | Tragic 97.8% |
| Immigrants | Zaire | 4.4 /100 | #220 | Tragic 97.8% |
| Tongans | 4.3 /100 | #221 | Tragic 97.8% |
| Immigrants | Syria | 4.0 /100 | #222 | Tragic 97.7% |
| Immigrants | Sudan | 3.9 /100 | #223 | Tragic 97.7% |
| Immigrants | Nepal | 3.6 /100 | #224 | Tragic 97.7% |
| Immigrants | Costa Rica | 3.5 /100 | #225 | Tragic 97.7% |
| Iraqis | 3.5 /100 | #226 | Tragic 97.7% |
| Sub-Saharan Africans | 3.2 /100 | #227 | Tragic 97.7% |
| Sudanese | 3.2 /100 | #228 | Tragic 97.7% |
| Senegalese | 3.2 /100 | #229 | Tragic 97.7% |
| Sierra Leoneans | 2.9 /100 | #230 | Tragic 97.7% |
| Puerto Ricans | 2.6 /100 | #231 | Tragic 97.7% |