Marshallese vs Immigrants from Syria Single Mother Poverty
COMPARE
Marshallese
Immigrants from Syria
Single Mother Poverty
Single Mother Poverty Comparison
Marshallese
Immigrants from Syria
32.1%
SINGLE MOTHER POVERTY
0.0/ 100
METRIC RATING
279th/ 347
METRIC RANK
28.3%
SINGLE MOTHER POVERTY
92.4/ 100
METRIC RATING
119th/ 347
METRIC RANK
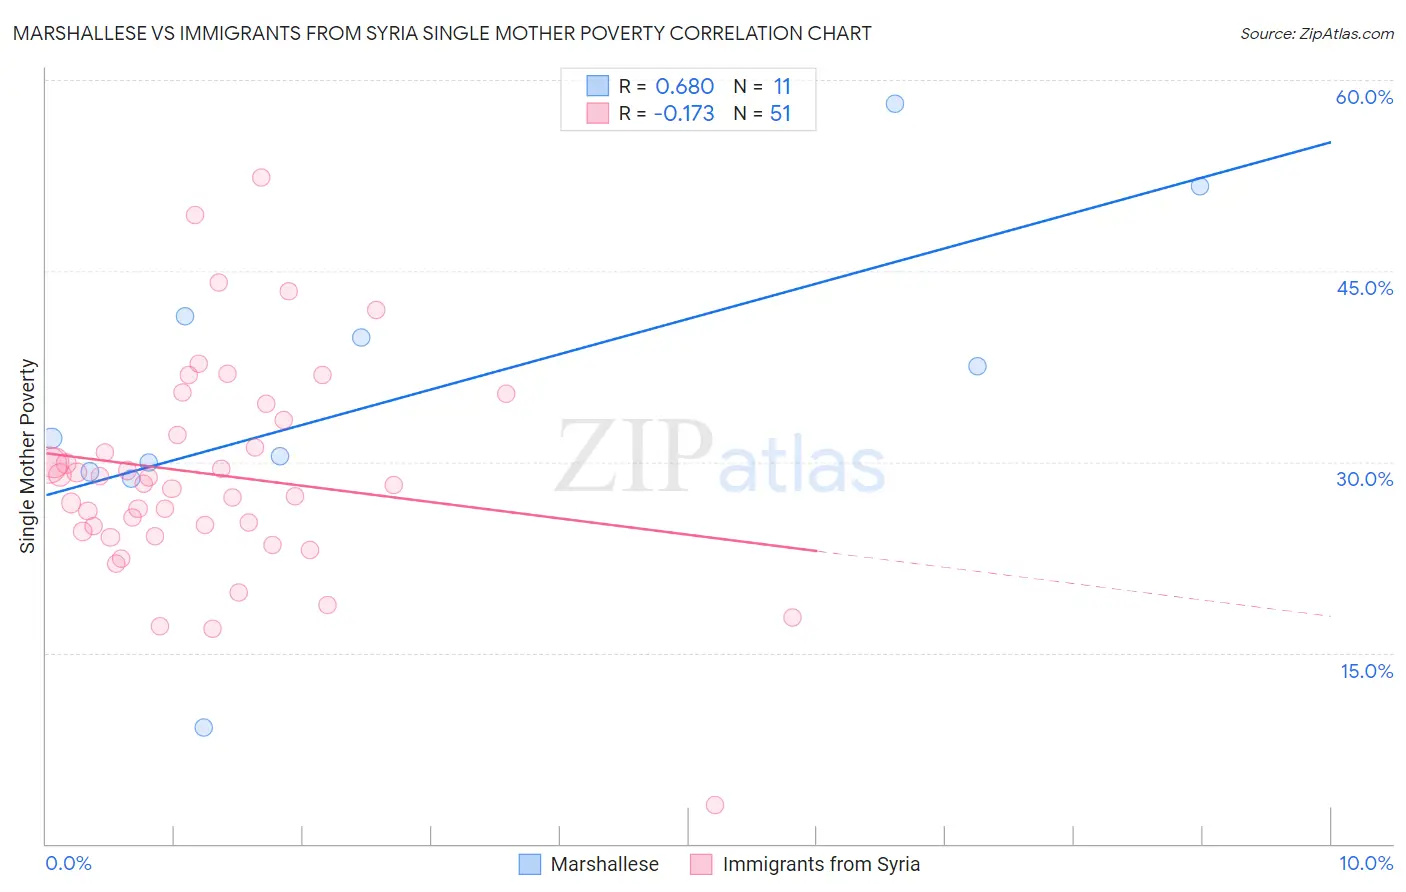
Marshallese vs Immigrants from Syria Single Mother Poverty Correlation Chart
The statistical analysis conducted on geographies consisting of 14,718,372 people shows a significant positive correlation between the proportion of Marshallese and poverty level among single mothers in the United States with a correlation coefficient (R) of 0.680 and weighted average of 32.1%. Similarly, the statistical analysis conducted on geographies consisting of 172,226,665 people shows a poor negative correlation between the proportion of Immigrants from Syria and poverty level among single mothers in the United States with a correlation coefficient (R) of -0.173 and weighted average of 28.3%, a difference of 13.4%.
Single Mother Poverty Correlation Summary
| Measurement | Marshallese | Immigrants from Syria |
| Minimum | 9.1% | 3.1% |
| Maximum | 58.1% | 52.4% |
| Range | 49.0% | 49.3% |
| Mean | 35.3% | 29.0% |
| Median | 31.9% | 28.3% |
| Interquartile 25% (IQ1) | 29.2% | 24.5% |
| Interquartile 75% (IQ3) | 41.5% | 33.3% |
| Interquartile Range (IQR) | 12.3% | 8.8% |
| Standard Deviation (Sample) | 13.0% | 8.5% |
| Standard Deviation (Population) | 12.4% | 8.4% |
Similar Demographics by Single Mother Poverty
Demographics Similar to Marshallese by Single Mother Poverty
In terms of single mother poverty, the demographic groups most similar to Marshallese are Nonimmigrants (32.2%, a difference of 0.22%), Cree (32.2%, a difference of 0.24%), Immigrants from the Azores (32.2%, a difference of 0.36%), Immigrants from Zaire (32.0%, a difference of 0.40%), and Spanish American (32.3%, a difference of 0.61%).
| Demographics | Rating | Rank | Single Mother Poverty |
| Immigrants | Micronesia | 0.1 /100 | #272 | Tragic 31.6% |
| Fijians | 0.1 /100 | #273 | Tragic 31.6% |
| Bangladeshis | 0.1 /100 | #274 | Tragic 31.7% |
| Central Americans | 0.1 /100 | #275 | Tragic 31.8% |
| Delaware | 0.0 /100 | #276 | Tragic 31.8% |
| Mexican American Indians | 0.0 /100 | #277 | Tragic 31.9% |
| Immigrants | Zaire | 0.0 /100 | #278 | Tragic 32.0% |
| Marshallese | 0.0 /100 | #279 | Tragic 32.1% |
| Immigrants | Nonimmigrants | 0.0 /100 | #280 | Tragic 32.2% |
| Cree | 0.0 /100 | #281 | Tragic 32.2% |
| Immigrants | Azores | 0.0 /100 | #282 | Tragic 32.2% |
| Spanish Americans | 0.0 /100 | #283 | Tragic 32.3% |
| Indonesians | 0.0 /100 | #284 | Tragic 32.4% |
| Immigrants | Latin America | 0.0 /100 | #285 | Tragic 32.4% |
| Yup'ik | 0.0 /100 | #286 | Tragic 32.5% |
Demographics Similar to Immigrants from Syria by Single Mother Poverty
In terms of single mother poverty, the demographic groups most similar to Immigrants from Syria are Brazilian (28.3%, a difference of 0.010%), Australian (28.3%, a difference of 0.020%), Cypriot (28.3%, a difference of 0.020%), Immigrants from Uganda (28.3%, a difference of 0.030%), and Immigrants from Kuwait (28.3%, a difference of 0.050%).
| Demographics | Rating | Rank | Single Mother Poverty |
| Immigrants | Kazakhstan | 94.5 /100 | #112 | Exceptional 28.2% |
| Immigrants | South Africa | 93.2 /100 | #113 | Exceptional 28.3% |
| Immigrants | Western Asia | 92.7 /100 | #114 | Exceptional 28.3% |
| Immigrants | Kuwait | 92.7 /100 | #115 | Exceptional 28.3% |
| Immigrants | Uganda | 92.5 /100 | #116 | Exceptional 28.3% |
| Australians | 92.5 /100 | #117 | Exceptional 28.3% |
| Brazilians | 92.4 /100 | #118 | Exceptional 28.3% |
| Immigrants | Syria | 92.4 /100 | #119 | Exceptional 28.3% |
| Cypriots | 92.3 /100 | #120 | Exceptional 28.3% |
| Immigrants | Afghanistan | 92.1 /100 | #121 | Exceptional 28.3% |
| Colombians | 91.8 /100 | #122 | Exceptional 28.3% |
| Uruguayans | 91.7 /100 | #123 | Exceptional 28.3% |
| Immigrants | Switzerland | 91.7 /100 | #124 | Exceptional 28.3% |
| Kenyans | 90.9 /100 | #125 | Exceptional 28.4% |
| Immigrants | Chile | 90.8 /100 | #126 | Exceptional 28.4% |