Marshallese vs Okinawan Male Poverty
COMPARE
Marshallese
Okinawan
Male Poverty
Male Poverty Comparison
Marshallese
Okinawans
12.5%
MALE POVERTY
0.8/ 100
METRIC RATING
230th/ 347
METRIC RANK
10.7%
MALE POVERTY
87.6/ 100
METRIC RATING
118th/ 347
METRIC RANK
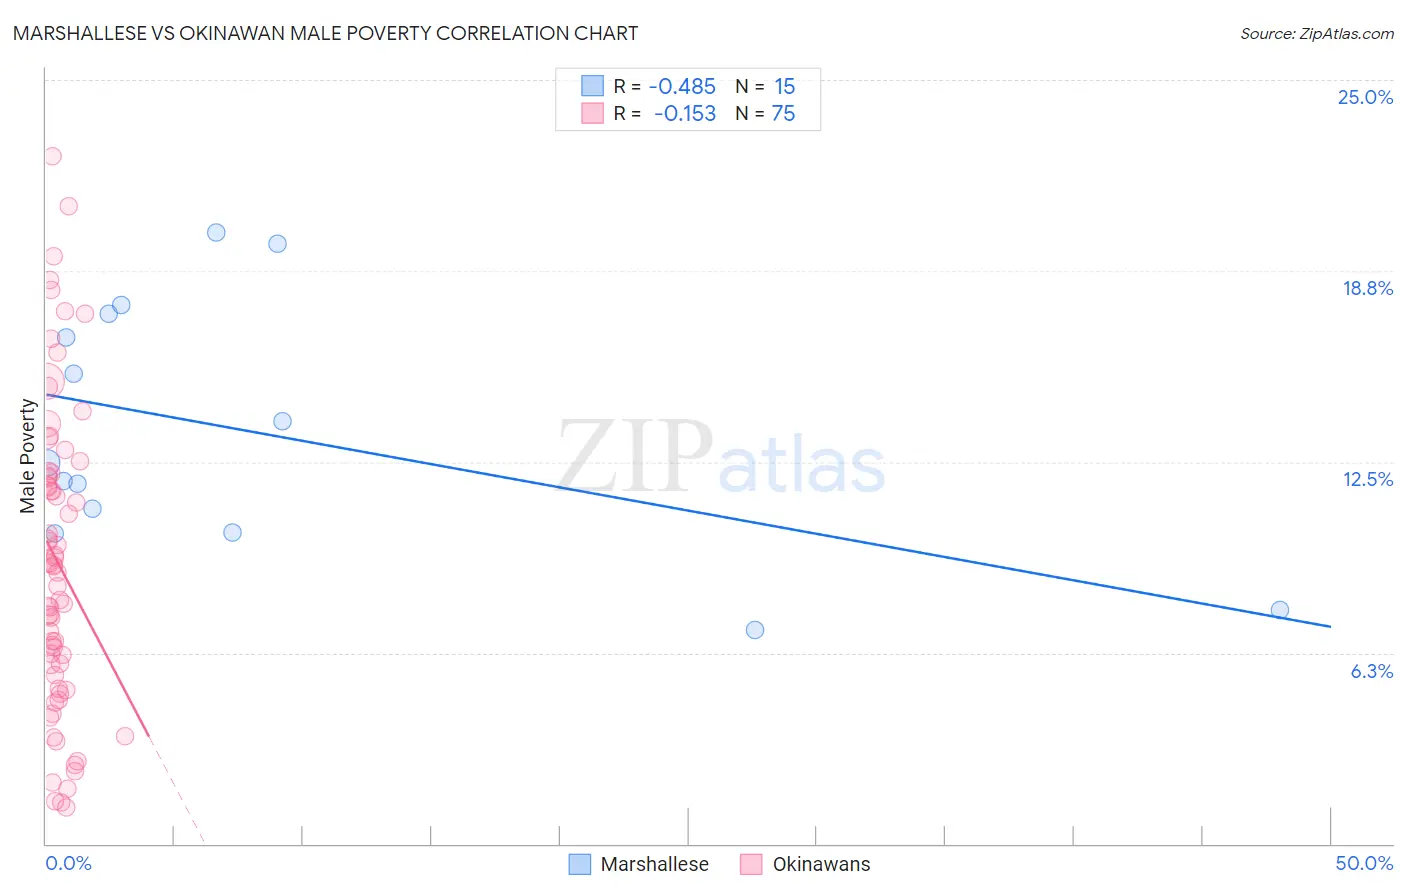
Marshallese vs Okinawan Male Poverty Correlation Chart
The statistical analysis conducted on geographies consisting of 14,760,991 people shows a moderate negative correlation between the proportion of Marshallese and poverty level among males in the United States with a correlation coefficient (R) of -0.485 and weighted average of 12.5%. Similarly, the statistical analysis conducted on geographies consisting of 73,717,243 people shows a poor negative correlation between the proportion of Okinawans and poverty level among males in the United States with a correlation coefficient (R) of -0.153 and weighted average of 10.7%, a difference of 17.3%.
Male Poverty Correlation Summary
| Measurement | Marshallese | Okinawan |
| Minimum | 7.0% | 1.2% |
| Maximum | 20.0% | 22.5% |
| Range | 13.0% | 21.3% |
| Mean | 13.5% | 9.2% |
| Median | 12.5% | 9.1% |
| Interquartile 25% (IQ1) | 10.2% | 5.5% |
| Interquartile 75% (IQ3) | 17.3% | 12.1% |
| Interquartile Range (IQR) | 7.2% | 6.6% |
| Standard Deviation (Sample) | 4.1% | 5.0% |
| Standard Deviation (Population) | 4.0% | 4.9% |
Similar Demographics by Male Poverty
Demographics Similar to Marshallese by Male Poverty
In terms of male poverty, the demographic groups most similar to Marshallese are Salvadoran (12.6%, a difference of 0.56%), Nicaraguan (12.6%, a difference of 0.68%), Fijian (12.6%, a difference of 0.72%), Immigrants from Armenia (12.6%, a difference of 0.79%), and Cuban (12.4%, a difference of 0.98%).
| Demographics | Rating | Rank | Male Poverty |
| Immigrants | Micronesia | 2.1 /100 | #223 | Tragic 12.2% |
| Immigrants | Nigeria | 1.6 /100 | #224 | Tragic 12.3% |
| Osage | 1.5 /100 | #225 | Tragic 12.3% |
| Nigerians | 1.4 /100 | #226 | Tragic 12.3% |
| Alaska Natives | 1.4 /100 | #227 | Tragic 12.4% |
| Alsatians | 1.3 /100 | #228 | Tragic 12.4% |
| Cubans | 1.3 /100 | #229 | Tragic 12.4% |
| Marshallese | 0.8 /100 | #230 | Tragic 12.5% |
| Salvadorans | 0.6 /100 | #231 | Tragic 12.6% |
| Nicaraguans | 0.6 /100 | #232 | Tragic 12.6% |
| Fijians | 0.6 /100 | #233 | Tragic 12.6% |
| Immigrants | Armenia | 0.6 /100 | #234 | Tragic 12.6% |
| Immigrants | Laos | 0.5 /100 | #235 | Tragic 12.6% |
| Immigrants | Saudi Arabia | 0.4 /100 | #236 | Tragic 12.7% |
| French American Indians | 0.4 /100 | #237 | Tragic 12.7% |
Demographics Similar to Okinawans by Male Poverty
In terms of male poverty, the demographic groups most similar to Okinawans are Immigrants from Hungary (10.7%, a difference of 0.010%), Immigrants from South Eastern Asia (10.6%, a difference of 0.11%), Immigrants from China (10.7%, a difference of 0.11%), Sri Lankan (10.6%, a difference of 0.12%), and Peruvian (10.7%, a difference of 0.12%).
| Demographics | Rating | Rank | Male Poverty |
| Immigrants | Argentina | 89.8 /100 | #111 | Excellent 10.6% |
| Immigrants | Turkey | 89.5 /100 | #112 | Excellent 10.6% |
| Palestinians | 89.1 /100 | #113 | Excellent 10.6% |
| Immigrants | Brazil | 89.0 /100 | #114 | Excellent 10.6% |
| Immigrants | Russia | 88.6 /100 | #115 | Excellent 10.6% |
| Sri Lankans | 88.1 /100 | #116 | Excellent 10.6% |
| Immigrants | South Eastern Asia | 88.1 /100 | #117 | Excellent 10.6% |
| Okinawans | 87.6 /100 | #118 | Excellent 10.7% |
| Immigrants | Hungary | 87.6 /100 | #119 | Excellent 10.7% |
| Immigrants | China | 87.1 /100 | #120 | Excellent 10.7% |
| Peruvians | 87.1 /100 | #121 | Excellent 10.7% |
| Native Hawaiians | 87.0 /100 | #122 | Excellent 10.7% |
| South Africans | 86.8 /100 | #123 | Excellent 10.7% |
| French | 86.7 /100 | #124 | Excellent 10.7% |
| Immigrants | Norway | 86.0 /100 | #125 | Excellent 10.7% |