Marshallese vs Armenian Male Poverty
COMPARE
Marshallese
Armenian
Male Poverty
Male Poverty Comparison
Marshallese
Armenians
12.5%
MALE POVERTY
0.8/ 100
METRIC RATING
230th/ 347
METRIC RANK
11.0%
MALE POVERTY
68.0/ 100
METRIC RATING
148th/ 347
METRIC RANK
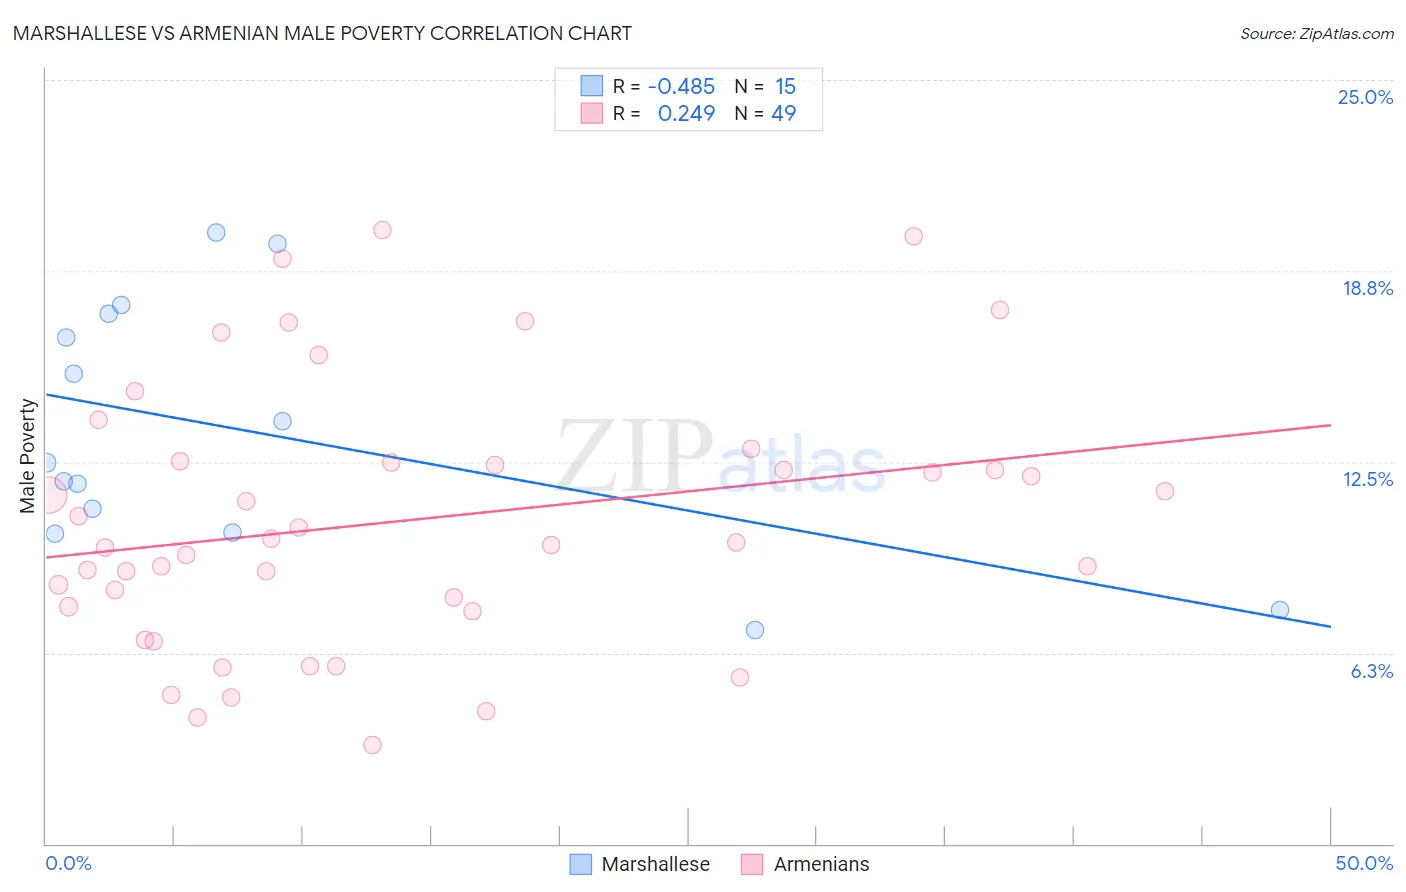
Marshallese vs Armenian Male Poverty Correlation Chart
The statistical analysis conducted on geographies consisting of 14,760,991 people shows a moderate negative correlation between the proportion of Marshallese and poverty level among males in the United States with a correlation coefficient (R) of -0.485 and weighted average of 12.5%. Similarly, the statistical analysis conducted on geographies consisting of 310,692,153 people shows a weak positive correlation between the proportion of Armenians and poverty level among males in the United States with a correlation coefficient (R) of 0.249 and weighted average of 11.0%, a difference of 13.8%.
Male Poverty Correlation Summary
| Measurement | Marshallese | Armenian |
| Minimum | 7.0% | 3.2% |
| Maximum | 20.0% | 20.1% |
| Range | 13.0% | 16.9% |
| Mean | 13.5% | 10.6% |
| Median | 12.5% | 9.9% |
| Interquartile 25% (IQ1) | 10.2% | 7.7% |
| Interquartile 75% (IQ3) | 17.3% | 12.5% |
| Interquartile Range (IQR) | 7.2% | 4.8% |
| Standard Deviation (Sample) | 4.1% | 4.3% |
| Standard Deviation (Population) | 4.0% | 4.2% |
Similar Demographics by Male Poverty
Demographics Similar to Marshallese by Male Poverty
In terms of male poverty, the demographic groups most similar to Marshallese are Salvadoran (12.6%, a difference of 0.56%), Nicaraguan (12.6%, a difference of 0.68%), Fijian (12.6%, a difference of 0.72%), Immigrants from Armenia (12.6%, a difference of 0.79%), and Cuban (12.4%, a difference of 0.98%).
| Demographics | Rating | Rank | Male Poverty |
| Immigrants | Micronesia | 2.1 /100 | #223 | Tragic 12.2% |
| Immigrants | Nigeria | 1.6 /100 | #224 | Tragic 12.3% |
| Osage | 1.5 /100 | #225 | Tragic 12.3% |
| Nigerians | 1.4 /100 | #226 | Tragic 12.3% |
| Alaska Natives | 1.4 /100 | #227 | Tragic 12.4% |
| Alsatians | 1.3 /100 | #228 | Tragic 12.4% |
| Cubans | 1.3 /100 | #229 | Tragic 12.4% |
| Marshallese | 0.8 /100 | #230 | Tragic 12.5% |
| Salvadorans | 0.6 /100 | #231 | Tragic 12.6% |
| Nicaraguans | 0.6 /100 | #232 | Tragic 12.6% |
| Fijians | 0.6 /100 | #233 | Tragic 12.6% |
| Immigrants | Armenia | 0.6 /100 | #234 | Tragic 12.6% |
| Immigrants | Laos | 0.5 /100 | #235 | Tragic 12.6% |
| Immigrants | Saudi Arabia | 0.4 /100 | #236 | Tragic 12.7% |
| French American Indians | 0.4 /100 | #237 | Tragic 12.7% |
Demographics Similar to Armenians by Male Poverty
In terms of male poverty, the demographic groups most similar to Armenians are Immigrants from Venezuela (11.0%, a difference of 0.020%), Icelander (11.0%, a difference of 0.050%), Guamanian/Chamorro (11.0%, a difference of 0.050%), Venezuelan (11.0%, a difference of 0.080%), and Immigrants from Nepal (11.0%, a difference of 0.080%).
| Demographics | Rating | Rank | Male Poverty |
| Immigrants | France | 75.8 /100 | #141 | Good 10.9% |
| Basques | 74.6 /100 | #142 | Good 10.9% |
| Afghans | 71.9 /100 | #143 | Good 10.9% |
| Samoans | 71.8 /100 | #144 | Good 10.9% |
| Immigrants | Germany | 71.6 /100 | #145 | Good 10.9% |
| Syrians | 71.4 /100 | #146 | Good 10.9% |
| Icelanders | 68.5 /100 | #147 | Good 11.0% |
| Armenians | 68.0 /100 | #148 | Good 11.0% |
| Immigrants | Venezuela | 67.9 /100 | #149 | Good 11.0% |
| Guamanians/Chamorros | 67.6 /100 | #150 | Good 11.0% |
| Venezuelans | 67.4 /100 | #151 | Good 11.0% |
| Immigrants | Nepal | 67.3 /100 | #152 | Good 11.0% |
| Immigrants | Bosnia and Herzegovina | 65.2 /100 | #153 | Good 11.0% |
| Immigrants | Kazakhstan | 64.8 /100 | #154 | Good 11.0% |
| Immigrants | Malaysia | 64.7 /100 | #155 | Good 11.0% |