Immigrants from Sudan vs Armenian Male Poverty
COMPARE
Immigrants from Sudan
Armenian
Male Poverty
Male Poverty Comparison
Immigrants from Sudan
Armenians
12.9%
MALE POVERTY
0.2/ 100
METRIC RATING
248th/ 347
METRIC RANK
11.0%
MALE POVERTY
68.0/ 100
METRIC RATING
148th/ 347
METRIC RANK
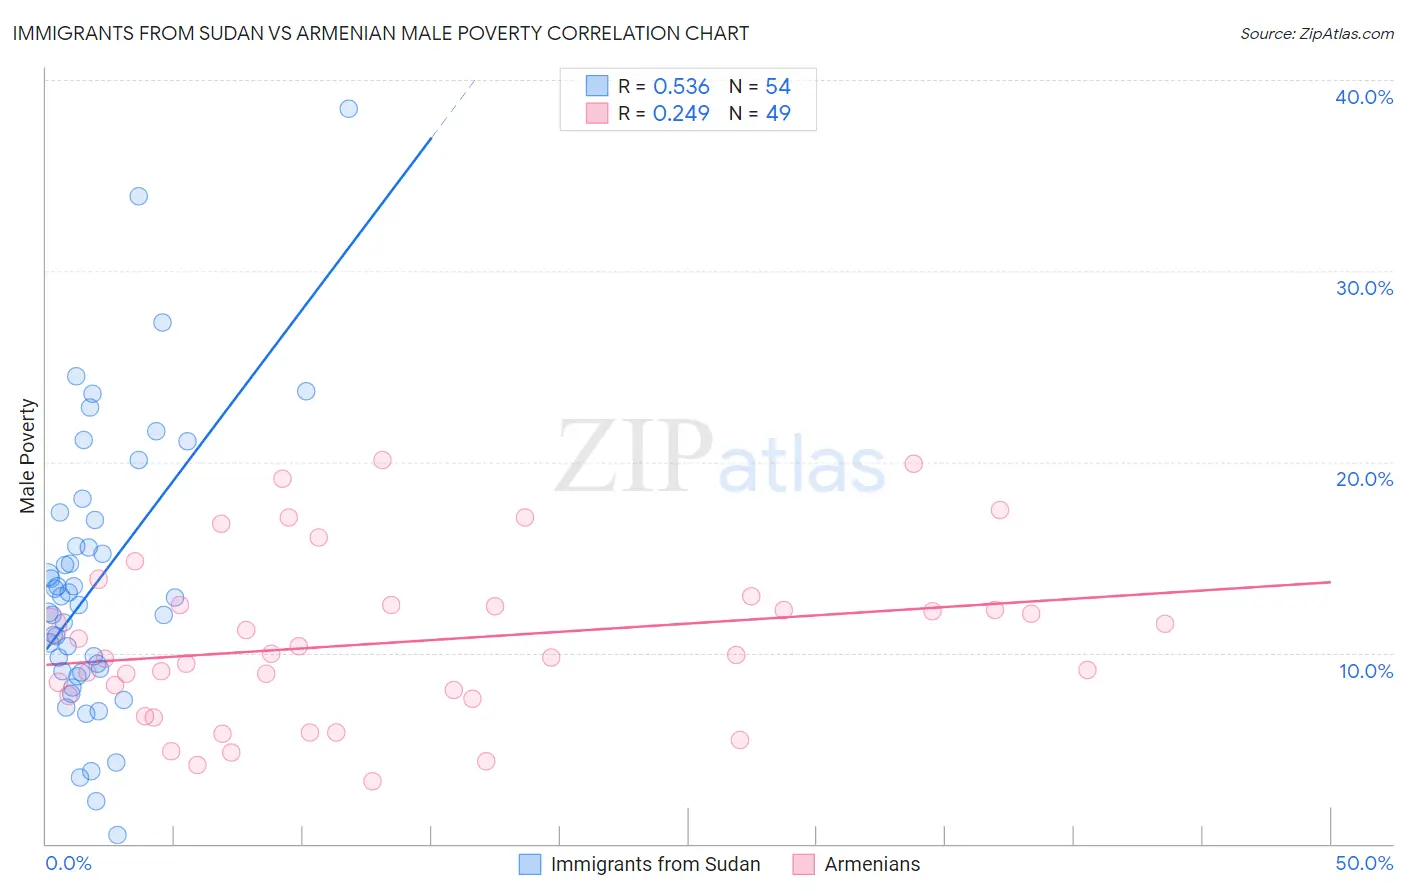
Immigrants from Sudan vs Armenian Male Poverty Correlation Chart
The statistical analysis conducted on geographies consisting of 118,946,491 people shows a substantial positive correlation between the proportion of Immigrants from Sudan and poverty level among males in the United States with a correlation coefficient (R) of 0.536 and weighted average of 12.9%. Similarly, the statistical analysis conducted on geographies consisting of 310,692,153 people shows a weak positive correlation between the proportion of Armenians and poverty level among males in the United States with a correlation coefficient (R) of 0.249 and weighted average of 11.0%, a difference of 17.4%.
Male Poverty Correlation Summary
| Measurement | Immigrants from Sudan | Armenian |
| Minimum | 0.44% | 3.2% |
| Maximum | 38.5% | 20.1% |
| Range | 38.1% | 16.9% |
| Mean | 13.7% | 10.6% |
| Median | 12.7% | 9.9% |
| Interquartile 25% (IQ1) | 9.0% | 7.7% |
| Interquartile 75% (IQ3) | 16.9% | 12.5% |
| Interquartile Range (IQR) | 7.9% | 4.8% |
| Standard Deviation (Sample) | 7.4% | 4.3% |
| Standard Deviation (Population) | 7.3% | 4.2% |
Similar Demographics by Male Poverty
Demographics Similar to Immigrants from Sudan by Male Poverty
In terms of male poverty, the demographic groups most similar to Immigrants from Sudan are Immigrants from Western Africa (12.9%, a difference of 0.060%), Potawatomi (12.9%, a difference of 0.070%), Immigrants from Nicaragua (12.9%, a difference of 0.080%), Immigrants from Cuba (12.9%, a difference of 0.18%), and Immigrants from Ecuador (12.9%, a difference of 0.21%).
| Demographics | Rating | Rank | Male Poverty |
| Sudanese | 0.3 /100 | #241 | Tragic 12.8% |
| Nepalese | 0.3 /100 | #242 | Tragic 12.8% |
| Alaskan Athabascans | 0.3 /100 | #243 | Tragic 12.8% |
| Tsimshian | 0.3 /100 | #244 | Tragic 12.8% |
| Liberians | 0.3 /100 | #245 | Tragic 12.8% |
| Immigrants | El Salvador | 0.2 /100 | #246 | Tragic 12.8% |
| Immigrants | Western Africa | 0.2 /100 | #247 | Tragic 12.9% |
| Immigrants | Sudan | 0.2 /100 | #248 | Tragic 12.9% |
| Potawatomi | 0.2 /100 | #249 | Tragic 12.9% |
| Immigrants | Nicaragua | 0.2 /100 | #250 | Tragic 12.9% |
| Immigrants | Cuba | 0.2 /100 | #251 | Tragic 12.9% |
| Immigrants | Ecuador | 0.2 /100 | #252 | Tragic 12.9% |
| Immigrants | Ghana | 0.2 /100 | #253 | Tragic 12.9% |
| Mexican American Indians | 0.1 /100 | #254 | Tragic 13.0% |
| Immigrants | Liberia | 0.1 /100 | #255 | Tragic 13.0% |
Demographics Similar to Armenians by Male Poverty
In terms of male poverty, the demographic groups most similar to Armenians are Immigrants from Venezuela (11.0%, a difference of 0.020%), Icelander (11.0%, a difference of 0.050%), Guamanian/Chamorro (11.0%, a difference of 0.050%), Venezuelan (11.0%, a difference of 0.080%), and Immigrants from Nepal (11.0%, a difference of 0.080%).
| Demographics | Rating | Rank | Male Poverty |
| Immigrants | France | 75.8 /100 | #141 | Good 10.9% |
| Basques | 74.6 /100 | #142 | Good 10.9% |
| Afghans | 71.9 /100 | #143 | Good 10.9% |
| Samoans | 71.8 /100 | #144 | Good 10.9% |
| Immigrants | Germany | 71.6 /100 | #145 | Good 10.9% |
| Syrians | 71.4 /100 | #146 | Good 10.9% |
| Icelanders | 68.5 /100 | #147 | Good 11.0% |
| Armenians | 68.0 /100 | #148 | Good 11.0% |
| Immigrants | Venezuela | 67.9 /100 | #149 | Good 11.0% |
| Guamanians/Chamorros | 67.6 /100 | #150 | Good 11.0% |
| Venezuelans | 67.4 /100 | #151 | Good 11.0% |
| Immigrants | Nepal | 67.3 /100 | #152 | Good 11.0% |
| Immigrants | Bosnia and Herzegovina | 65.2 /100 | #153 | Good 11.0% |
| Immigrants | Kazakhstan | 64.8 /100 | #154 | Good 11.0% |
| Immigrants | Malaysia | 64.7 /100 | #155 | Good 11.0% |