Marshallese vs Armenian Female Poverty Among 25-34 Year Olds
COMPARE
Marshallese
Armenian
Female Poverty Among 25-34 Year Olds
Female Poverty Among 25-34 Year Olds Comparison
Marshallese
Armenians
15.3%
FEMALE POVERTY AMONG 25-34 YEAR OLDS
0.2/ 100
METRIC RATING
260th/ 347
METRIC RANK
12.2%
FEMALE POVERTY AMONG 25-34 YEAR OLDS
99.2/ 100
METRIC RATING
65th/ 347
METRIC RANK
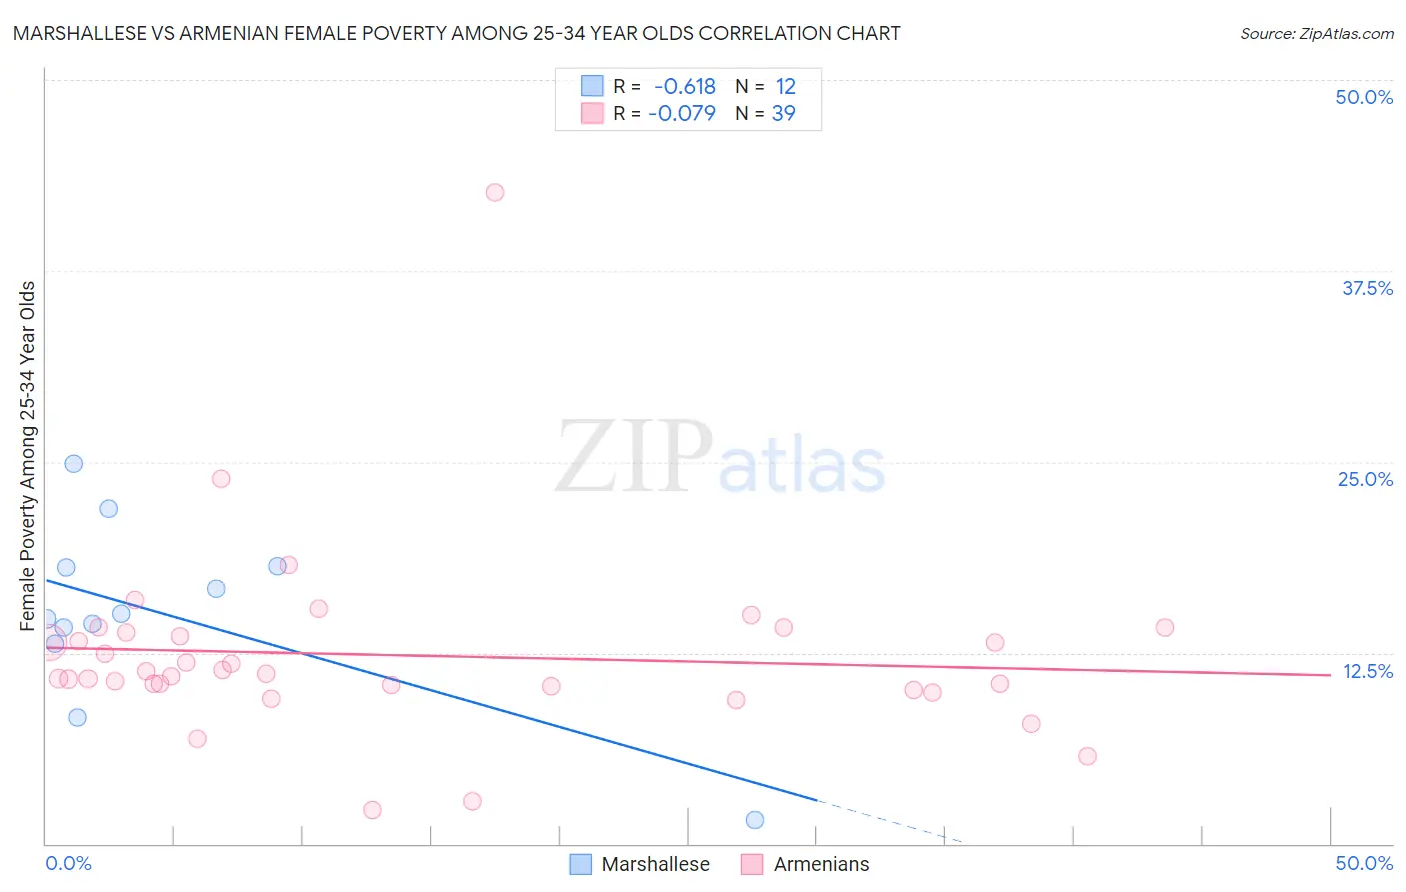
Marshallese vs Armenian Female Poverty Among 25-34 Year Olds Correlation Chart
The statistical analysis conducted on geographies consisting of 14,731,838 people shows a significant negative correlation between the proportion of Marshallese and poverty level among females between the ages 25 and 34 in the United States with a correlation coefficient (R) of -0.618 and weighted average of 15.3%. Similarly, the statistical analysis conducted on geographies consisting of 305,860,735 people shows a slight negative correlation between the proportion of Armenians and poverty level among females between the ages 25 and 34 in the United States with a correlation coefficient (R) of -0.079 and weighted average of 12.2%, a difference of 25.6%.
Female Poverty Among 25-34 Year Olds Correlation Summary
| Measurement | Marshallese | Armenian |
| Minimum | 1.5% | 2.2% |
| Maximum | 24.8% | 42.7% |
| Range | 23.3% | 40.4% |
| Mean | 15.1% | 12.3% |
| Median | 14.9% | 11.1% |
| Interquartile 25% (IQ1) | 13.6% | 10.3% |
| Interquartile 75% (IQ3) | 18.1% | 13.8% |
| Interquartile Range (IQR) | 4.5% | 3.6% |
| Standard Deviation (Sample) | 6.0% | 6.2% |
| Standard Deviation (Population) | 5.8% | 6.2% |
Similar Demographics by Female Poverty Among 25-34 Year Olds
Demographics Similar to Marshallese by Female Poverty Among 25-34 Year Olds
In terms of female poverty among 25-34 year olds, the demographic groups most similar to Marshallese are Liberian (15.3%, a difference of 0.22%), Immigrants from Belize (15.3%, a difference of 0.26%), Immigrants from Cuba (15.2%, a difference of 0.37%), Nepalese (15.2%, a difference of 0.39%), and Mexican American Indian (15.4%, a difference of 0.50%).
| Demographics | Rating | Rank | Female Poverty Among 25-34 Year Olds |
| Immigrants | West Indies | 0.4 /100 | #253 | Tragic 15.1% |
| Somalis | 0.4 /100 | #254 | Tragic 15.1% |
| Immigrants | Laos | 0.3 /100 | #255 | Tragic 15.2% |
| West Indians | 0.3 /100 | #256 | Tragic 15.2% |
| Immigrants | Burma/Myanmar | 0.3 /100 | #257 | Tragic 15.2% |
| Nepalese | 0.2 /100 | #258 | Tragic 15.2% |
| Immigrants | Cuba | 0.2 /100 | #259 | Tragic 15.2% |
| Marshallese | 0.2 /100 | #260 | Tragic 15.3% |
| Liberians | 0.2 /100 | #261 | Tragic 15.3% |
| Immigrants | Belize | 0.2 /100 | #262 | Tragic 15.3% |
| Mexican American Indians | 0.2 /100 | #263 | Tragic 15.4% |
| Pennsylvania Germans | 0.1 /100 | #264 | Tragic 15.4% |
| Immigrants | Liberia | 0.1 /100 | #265 | Tragic 15.4% |
| Immigrants | Somalia | 0.1 /100 | #266 | Tragic 15.4% |
| Central Americans | 0.1 /100 | #267 | Tragic 15.5% |
Demographics Similar to Armenians by Female Poverty Among 25-34 Year Olds
In terms of female poverty among 25-34 year olds, the demographic groups most similar to Armenians are Immigrants from Russia (12.2%, a difference of 0.020%), Immigrants from Europe (12.2%, a difference of 0.060%), Laotian (12.2%, a difference of 0.17%), Soviet Union (12.1%, a difference of 0.25%), and Immigrants from Moldova (12.1%, a difference of 0.27%).
| Demographics | Rating | Rank | Female Poverty Among 25-34 Year Olds |
| Immigrants | Romania | 99.4 /100 | #58 | Exceptional 12.1% |
| Russians | 99.4 /100 | #59 | Exceptional 12.1% |
| Immigrants | Northern Europe | 99.4 /100 | #60 | Exceptional 12.1% |
| Immigrants | Czechoslovakia | 99.4 /100 | #61 | Exceptional 12.1% |
| Immigrants | Moldova | 99.3 /100 | #62 | Exceptional 12.1% |
| Soviet Union | 99.3 /100 | #63 | Exceptional 12.1% |
| Immigrants | Russia | 99.2 /100 | #64 | Exceptional 12.2% |
| Armenians | 99.2 /100 | #65 | Exceptional 12.2% |
| Immigrants | Europe | 99.2 /100 | #66 | Exceptional 12.2% |
| Laotians | 99.2 /100 | #67 | Exceptional 12.2% |
| Sri Lankans | 99.1 /100 | #68 | Exceptional 12.2% |
| Immigrants | Lebanon | 99.1 /100 | #69 | Exceptional 12.2% |
| Immigrants | Belgium | 99.1 /100 | #70 | Exceptional 12.2% |
| Immigrants | Scotland | 99.1 /100 | #71 | Exceptional 12.2% |
| Lithuanians | 99.1 /100 | #72 | Exceptional 12.2% |