Immigrants from Caribbean vs Armenian Male Poverty
COMPARE
Immigrants from Caribbean
Armenian
Male Poverty
Male Poverty Comparison
Immigrants from Caribbean
Armenians
14.0%
MALE POVERTY
0.0/ 100
METRIC RATING
302nd/ 347
METRIC RANK
11.0%
MALE POVERTY
68.0/ 100
METRIC RATING
148th/ 347
METRIC RANK
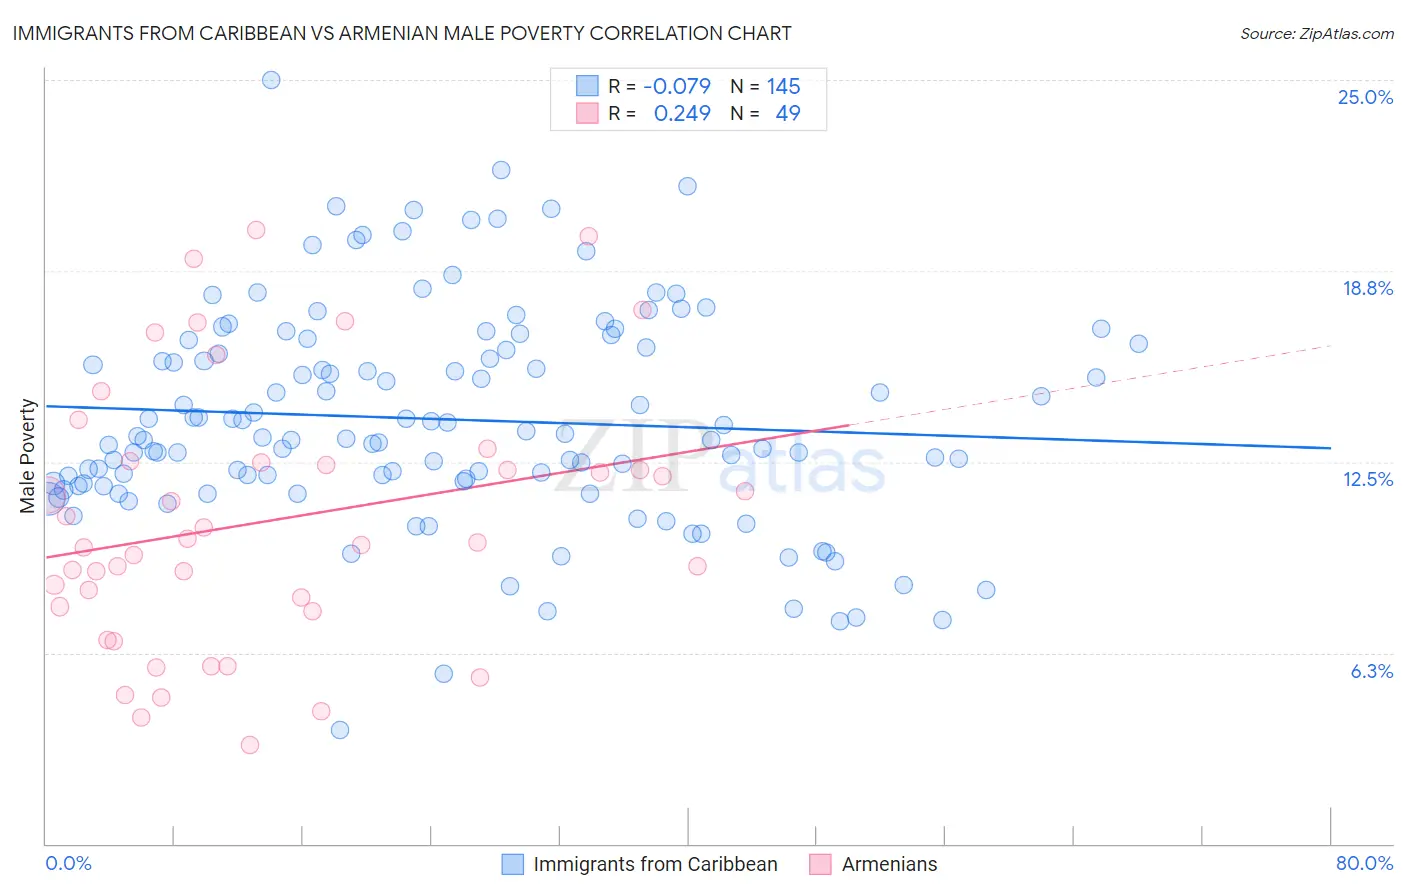
Immigrants from Caribbean vs Armenian Male Poverty Correlation Chart
The statistical analysis conducted on geographies consisting of 449,415,069 people shows a slight negative correlation between the proportion of Immigrants from Caribbean and poverty level among males in the United States with a correlation coefficient (R) of -0.079 and weighted average of 14.0%. Similarly, the statistical analysis conducted on geographies consisting of 310,692,153 people shows a weak positive correlation between the proportion of Armenians and poverty level among males in the United States with a correlation coefficient (R) of 0.249 and weighted average of 11.0%, a difference of 27.9%.
Male Poverty Correlation Summary
| Measurement | Immigrants from Caribbean | Armenian |
| Minimum | 3.7% | 3.2% |
| Maximum | 25.0% | 20.1% |
| Range | 21.3% | 16.9% |
| Mean | 13.9% | 10.6% |
| Median | 13.3% | 9.9% |
| Interquartile 25% (IQ1) | 11.8% | 7.7% |
| Interquartile 75% (IQ3) | 16.3% | 12.5% |
| Interquartile Range (IQR) | 4.5% | 4.8% |
| Standard Deviation (Sample) | 3.5% | 4.3% |
| Standard Deviation (Population) | 3.5% | 4.2% |
Similar Demographics by Male Poverty
Demographics Similar to Immigrants from Caribbean by Male Poverty
In terms of male poverty, the demographic groups most similar to Immigrants from Caribbean are Bahamian (14.1%, a difference of 0.040%), Immigrants from Senegal (14.0%, a difference of 0.060%), Immigrants from Mexico (14.0%, a difference of 0.13%), Senegalese (14.1%, a difference of 0.14%), and Immigrants from Guatemala (14.0%, a difference of 0.24%).
| Demographics | Rating | Rank | Male Poverty |
| Immigrants | Central America | 0.0 /100 | #295 | Tragic 13.9% |
| Cajuns | 0.0 /100 | #296 | Tragic 13.9% |
| Inupiat | 0.0 /100 | #297 | Tragic 14.0% |
| Blackfeet | 0.0 /100 | #298 | Tragic 14.0% |
| Immigrants | Guatemala | 0.0 /100 | #299 | Tragic 14.0% |
| Immigrants | Mexico | 0.0 /100 | #300 | Tragic 14.0% |
| Immigrants | Senegal | 0.0 /100 | #301 | Tragic 14.0% |
| Immigrants | Caribbean | 0.0 /100 | #302 | Tragic 14.0% |
| Bahamians | 0.0 /100 | #303 | Tragic 14.1% |
| Senegalese | 0.0 /100 | #304 | Tragic 14.1% |
| Immigrants | Bangladesh | 0.0 /100 | #305 | Tragic 14.1% |
| Creek | 0.0 /100 | #306 | Tragic 14.1% |
| Dutch West Indians | 0.0 /100 | #307 | Tragic 14.2% |
| Africans | 0.0 /100 | #308 | Tragic 14.2% |
| Somalis | 0.0 /100 | #309 | Tragic 14.3% |
Demographics Similar to Armenians by Male Poverty
In terms of male poverty, the demographic groups most similar to Armenians are Immigrants from Venezuela (11.0%, a difference of 0.020%), Icelander (11.0%, a difference of 0.050%), Guamanian/Chamorro (11.0%, a difference of 0.050%), Venezuelan (11.0%, a difference of 0.080%), and Immigrants from Nepal (11.0%, a difference of 0.080%).
| Demographics | Rating | Rank | Male Poverty |
| Immigrants | France | 75.8 /100 | #141 | Good 10.9% |
| Basques | 74.6 /100 | #142 | Good 10.9% |
| Afghans | 71.9 /100 | #143 | Good 10.9% |
| Samoans | 71.8 /100 | #144 | Good 10.9% |
| Immigrants | Germany | 71.6 /100 | #145 | Good 10.9% |
| Syrians | 71.4 /100 | #146 | Good 10.9% |
| Icelanders | 68.5 /100 | #147 | Good 11.0% |
| Armenians | 68.0 /100 | #148 | Good 11.0% |
| Immigrants | Venezuela | 67.9 /100 | #149 | Good 11.0% |
| Guamanians/Chamorros | 67.6 /100 | #150 | Good 11.0% |
| Venezuelans | 67.4 /100 | #151 | Good 11.0% |
| Immigrants | Nepal | 67.3 /100 | #152 | Good 11.0% |
| Immigrants | Bosnia and Herzegovina | 65.2 /100 | #153 | Good 11.0% |
| Immigrants | Kazakhstan | 64.8 /100 | #154 | Good 11.0% |
| Immigrants | Malaysia | 64.7 /100 | #155 | Good 11.0% |