Immigrants from Poland vs Armenian Male Poverty
COMPARE
Immigrants from Poland
Armenian
Male Poverty
Male Poverty Comparison
Immigrants from Poland
Armenians
9.8%
MALE POVERTY
99.5/ 100
METRIC RATING
34th/ 347
METRIC RANK
11.0%
MALE POVERTY
68.0/ 100
METRIC RATING
148th/ 347
METRIC RANK
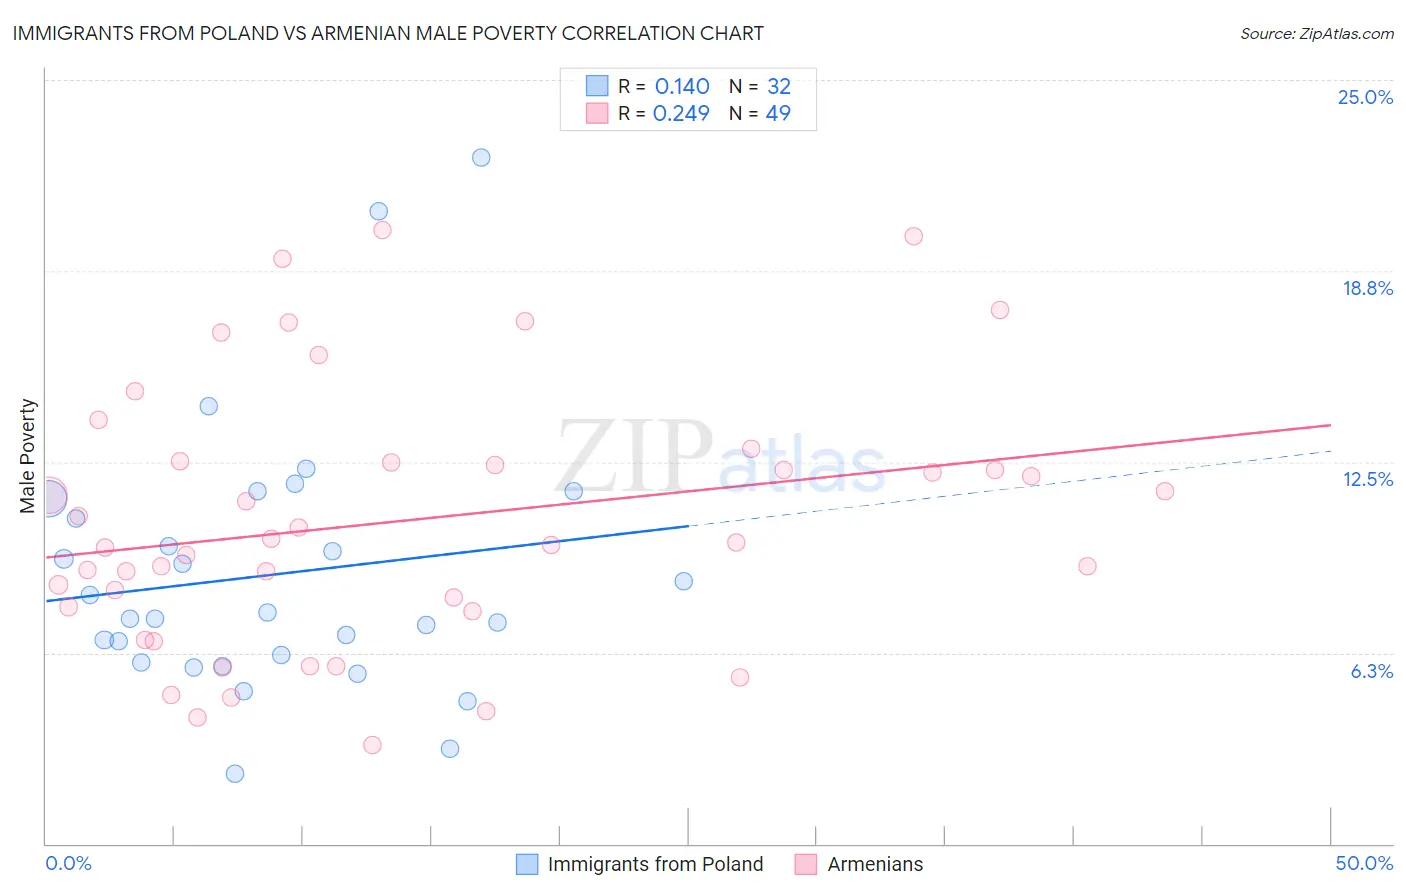
Immigrants from Poland vs Armenian Male Poverty Correlation Chart
The statistical analysis conducted on geographies consisting of 304,660,101 people shows a poor positive correlation between the proportion of Immigrants from Poland and poverty level among males in the United States with a correlation coefficient (R) of 0.140 and weighted average of 9.8%. Similarly, the statistical analysis conducted on geographies consisting of 310,692,153 people shows a weak positive correlation between the proportion of Armenians and poverty level among males in the United States with a correlation coefficient (R) of 0.249 and weighted average of 11.0%, a difference of 12.5%.
Male Poverty Correlation Summary
| Measurement | Immigrants from Poland | Armenian |
| Minimum | 2.3% | 3.2% |
| Maximum | 22.5% | 20.1% |
| Range | 20.2% | 16.9% |
| Mean | 8.8% | 10.6% |
| Median | 7.5% | 9.9% |
| Interquartile 25% (IQ1) | 6.0% | 7.7% |
| Interquartile 75% (IQ3) | 11.0% | 12.5% |
| Interquartile Range (IQR) | 4.9% | 4.8% |
| Standard Deviation (Sample) | 4.3% | 4.3% |
| Standard Deviation (Population) | 4.3% | 4.2% |
Similar Demographics by Male Poverty
Demographics Similar to Immigrants from Poland by Male Poverty
In terms of male poverty, the demographic groups most similar to Immigrants from Poland are Immigrants from Northern Europe (9.7%, a difference of 0.15%), Macedonian (9.7%, a difference of 0.23%), Iranian (9.8%, a difference of 0.30%), Czech (9.8%, a difference of 0.39%), and Tongan (9.7%, a difference of 0.44%).
| Demographics | Rating | Rank | Male Poverty |
| Danes | 99.6 /100 | #27 | Exceptional 9.7% |
| Immigrants | Korea | 99.6 /100 | #28 | Exceptional 9.7% |
| Greeks | 99.6 /100 | #29 | Exceptional 9.7% |
| Poles | 99.5 /100 | #30 | Exceptional 9.7% |
| Tongans | 99.5 /100 | #31 | Exceptional 9.7% |
| Macedonians | 99.5 /100 | #32 | Exceptional 9.7% |
| Immigrants | Northern Europe | 99.5 /100 | #33 | Exceptional 9.7% |
| Immigrants | Poland | 99.5 /100 | #34 | Exceptional 9.8% |
| Iranians | 99.4 /100 | #35 | Exceptional 9.8% |
| Czechs | 99.4 /100 | #36 | Exceptional 9.8% |
| Immigrants | Greece | 99.3 /100 | #37 | Exceptional 9.8% |
| Immigrants | Pakistan | 99.2 /100 | #38 | Exceptional 9.9% |
| Russians | 99.2 /100 | #39 | Exceptional 9.9% |
| Cypriots | 99.2 /100 | #40 | Exceptional 9.9% |
| Koreans | 99.2 /100 | #41 | Exceptional 9.9% |
Demographics Similar to Armenians by Male Poverty
In terms of male poverty, the demographic groups most similar to Armenians are Immigrants from Venezuela (11.0%, a difference of 0.020%), Icelander (11.0%, a difference of 0.050%), Guamanian/Chamorro (11.0%, a difference of 0.050%), Venezuelan (11.0%, a difference of 0.080%), and Immigrants from Nepal (11.0%, a difference of 0.080%).
| Demographics | Rating | Rank | Male Poverty |
| Immigrants | France | 75.8 /100 | #141 | Good 10.9% |
| Basques | 74.6 /100 | #142 | Good 10.9% |
| Afghans | 71.9 /100 | #143 | Good 10.9% |
| Samoans | 71.8 /100 | #144 | Good 10.9% |
| Immigrants | Germany | 71.6 /100 | #145 | Good 10.9% |
| Syrians | 71.4 /100 | #146 | Good 10.9% |
| Icelanders | 68.5 /100 | #147 | Good 11.0% |
| Armenians | 68.0 /100 | #148 | Good 11.0% |
| Immigrants | Venezuela | 67.9 /100 | #149 | Good 11.0% |
| Guamanians/Chamorros | 67.6 /100 | #150 | Good 11.0% |
| Venezuelans | 67.4 /100 | #151 | Good 11.0% |
| Immigrants | Nepal | 67.3 /100 | #152 | Good 11.0% |
| Immigrants | Bosnia and Herzegovina | 65.2 /100 | #153 | Good 11.0% |
| Immigrants | Kazakhstan | 64.8 /100 | #154 | Good 11.0% |
| Immigrants | Malaysia | 64.7 /100 | #155 | Good 11.0% |