Malaysian vs Bermudan Cognitive Disability
COMPARE
Malaysian
Bermudan
Cognitive Disability
Cognitive Disability Comparison
Malaysians
Bermudans
17.9%
COGNITIVE DISABILITY
0.6/ 100
METRIC RATING
251st/ 347
METRIC RANK
18.1%
COGNITIVE DISABILITY
0.1/ 100
METRIC RATING
285th/ 347
METRIC RANK
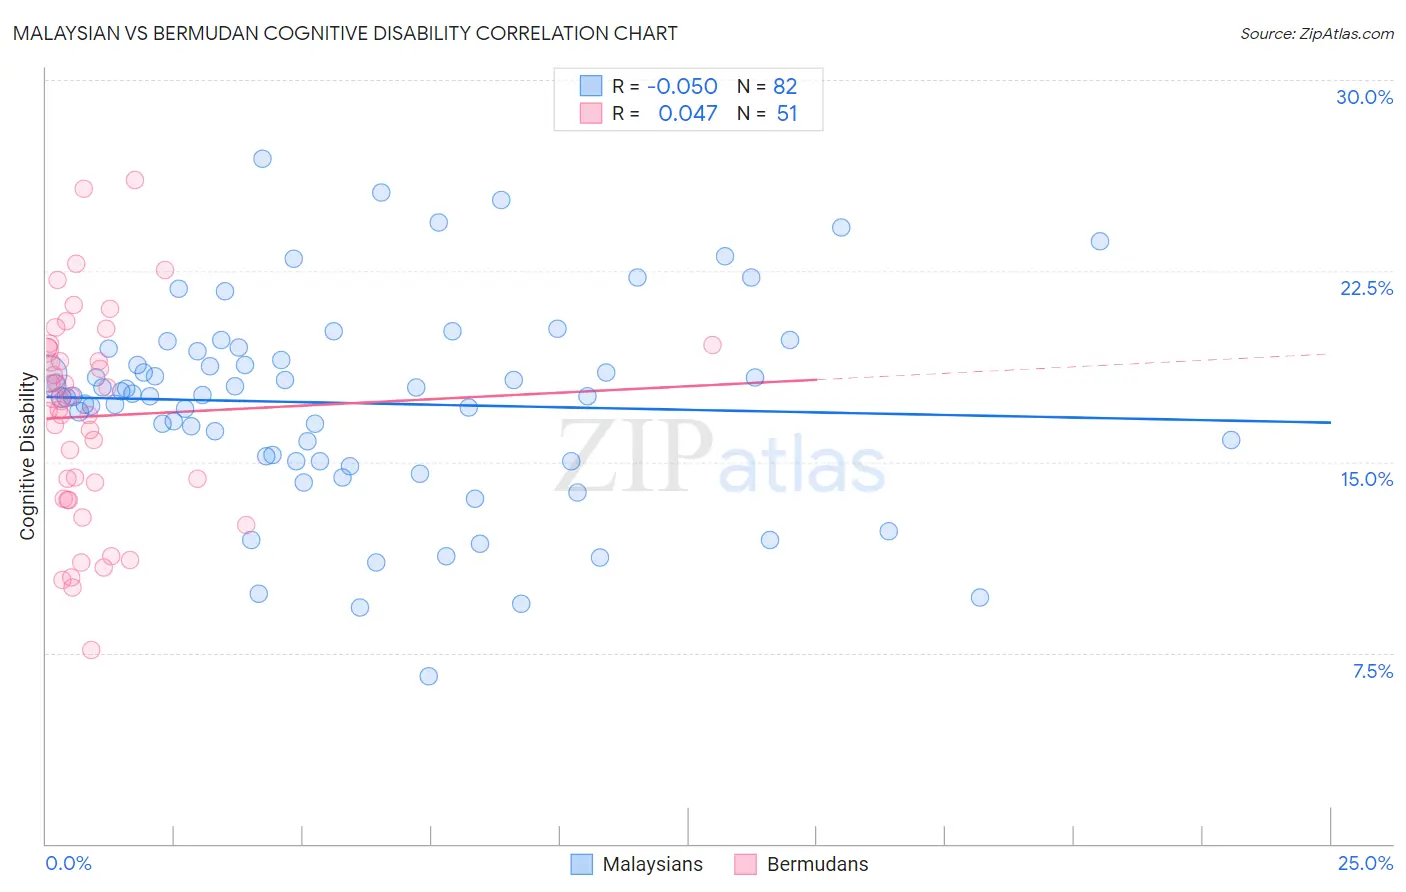
Malaysian vs Bermudan Cognitive Disability Correlation Chart
The statistical analysis conducted on geographies consisting of 226,070,316 people shows a slight negative correlation between the proportion of Malaysians and percentage of population with cognitive disability in the United States with a correlation coefficient (R) of -0.050 and weighted average of 17.9%. Similarly, the statistical analysis conducted on geographies consisting of 55,721,081 people shows no correlation between the proportion of Bermudans and percentage of population with cognitive disability in the United States with a correlation coefficient (R) of 0.047 and weighted average of 18.1%, a difference of 1.3%.
Cognitive Disability Correlation Summary
| Measurement | Malaysian | Bermudan |
| Minimum | 6.6% | 7.6% |
| Maximum | 26.9% | 26.1% |
| Range | 20.3% | 18.5% |
| Mean | 17.3% | 16.8% |
| Median | 17.6% | 17.4% |
| Interquartile 25% (IQ1) | 15.0% | 13.6% |
| Interquartile 75% (IQ3) | 19.3% | 19.5% |
| Interquartile Range (IQR) | 4.3% | 5.9% |
| Standard Deviation (Sample) | 4.0% | 4.1% |
| Standard Deviation (Population) | 3.9% | 4.0% |
Similar Demographics by Cognitive Disability
Demographics Similar to Malaysians by Cognitive Disability
In terms of cognitive disability, the demographic groups most similar to Malaysians are Cree (17.9%, a difference of 0.010%), Immigrants from Ethiopia (17.9%, a difference of 0.010%), Immigrants from Grenada (17.9%, a difference of 0.010%), Hopi (17.9%, a difference of 0.030%), and Hispanic or Latino (17.9%, a difference of 0.030%).
| Demographics | Rating | Rank | Cognitive Disability |
| Jamaicans | 0.9 /100 | #244 | Tragic 17.9% |
| Trinidadians and Tobagonians | 0.8 /100 | #245 | Tragic 17.9% |
| Immigrants | Thailand | 0.8 /100 | #246 | Tragic 17.9% |
| Samoans | 0.7 /100 | #247 | Tragic 17.9% |
| French American Indians | 0.7 /100 | #248 | Tragic 17.9% |
| Cree | 0.7 /100 | #249 | Tragic 17.9% |
| Immigrants | Ethiopia | 0.7 /100 | #250 | Tragic 17.9% |
| Malaysians | 0.6 /100 | #251 | Tragic 17.9% |
| Immigrants | Grenada | 0.6 /100 | #252 | Tragic 17.9% |
| Hopi | 0.6 /100 | #253 | Tragic 17.9% |
| Hispanics or Latinos | 0.6 /100 | #254 | Tragic 17.9% |
| Immigrants | Azores | 0.6 /100 | #255 | Tragic 17.9% |
| Bahamians | 0.6 /100 | #256 | Tragic 17.9% |
| Mexican American Indians | 0.6 /100 | #257 | Tragic 17.9% |
| Immigrants | Armenia | 0.6 /100 | #258 | Tragic 17.9% |
Demographics Similar to Bermudans by Cognitive Disability
In terms of cognitive disability, the demographic groups most similar to Bermudans are Immigrants from Uganda (18.1%, a difference of 0.010%), Kenyan (18.1%, a difference of 0.040%), Nigerian (18.1%, a difference of 0.050%), Immigrants from Cambodia (18.1%, a difference of 0.080%), and Dutch West Indian (18.1%, a difference of 0.080%).
| Demographics | Rating | Rank | Cognitive Disability |
| Immigrants | Micronesia | 0.2 /100 | #278 | Tragic 18.1% |
| Chippewa | 0.1 /100 | #279 | Tragic 18.1% |
| West Indians | 0.1 /100 | #280 | Tragic 18.1% |
| Yakama | 0.1 /100 | #281 | Tragic 18.1% |
| Immigrants | Cambodia | 0.1 /100 | #282 | Tragic 18.1% |
| Nigerians | 0.1 /100 | #283 | Tragic 18.1% |
| Immigrants | Uganda | 0.1 /100 | #284 | Tragic 18.1% |
| Bermudans | 0.1 /100 | #285 | Tragic 18.1% |
| Kenyans | 0.1 /100 | #286 | Tragic 18.1% |
| Dutch West Indians | 0.1 /100 | #287 | Tragic 18.1% |
| Immigrants | West Indies | 0.1 /100 | #288 | Tragic 18.1% |
| Natives/Alaskans | 0.1 /100 | #289 | Tragic 18.1% |
| Immigrants | Africa | 0.1 /100 | #290 | Tragic 18.1% |
| Ottawa | 0.1 /100 | #291 | Tragic 18.2% |
| Iroquois | 0.1 /100 | #292 | Tragic 18.2% |