Basque vs Immigrants from Western Europe Single Male Poverty
COMPARE
Basque
Immigrants from Western Europe
Single Male Poverty
Single Male Poverty Comparison
Basques
Immigrants from Western Europe
13.0%
SINGLE MALE POVERTY
20.7/ 100
METRIC RATING
202nd/ 347
METRIC RANK
13.2%
SINGLE MALE POVERTY
10.0/ 100
METRIC RATING
222nd/ 347
METRIC RANK
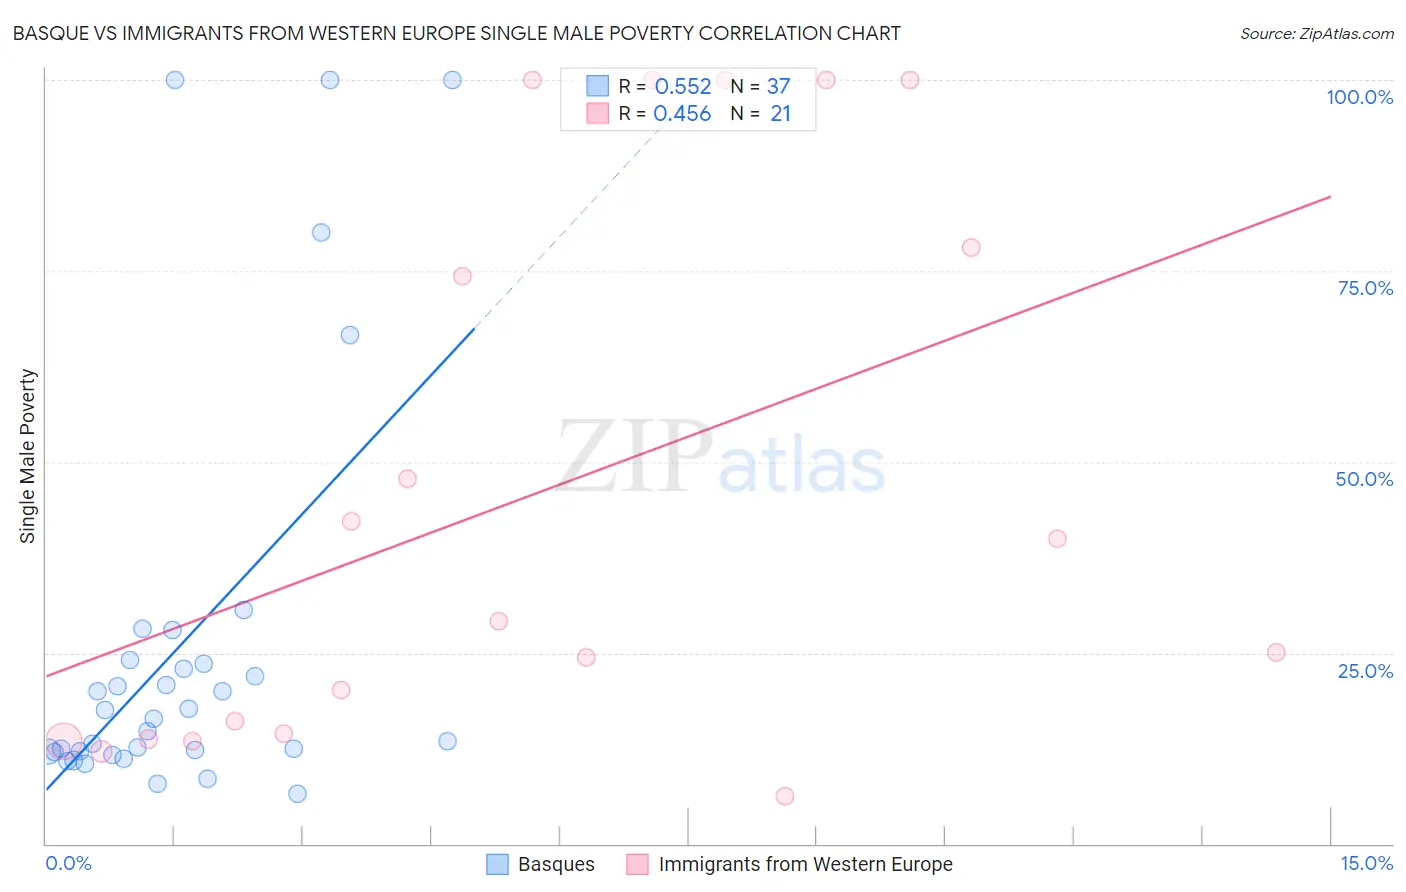
Basque vs Immigrants from Western Europe Single Male Poverty Correlation Chart
The statistical analysis conducted on geographies consisting of 155,521,610 people shows a substantial positive correlation between the proportion of Basques and poverty level among single males in the United States with a correlation coefficient (R) of 0.552 and weighted average of 13.0%. Similarly, the statistical analysis conducted on geographies consisting of 423,836,608 people shows a moderate positive correlation between the proportion of Immigrants from Western Europe and poverty level among single males in the United States with a correlation coefficient (R) of 0.456 and weighted average of 13.2%, a difference of 1.1%.
Single Male Poverty Correlation Summary
| Measurement | Basque | Immigrants from Western Europe |
| Minimum | 6.6% | 6.2% |
| Maximum | 100.0% | 100.0% |
| Range | 93.4% | 93.8% |
| Mean | 26.0% | 46.2% |
| Median | 16.3% | 29.2% |
| Interquartile 25% (IQ1) | 12.0% | 14.1% |
| Interquartile 75% (IQ3) | 23.8% | 89.0% |
| Interquartile Range (IQR) | 11.8% | 74.9% |
| Standard Deviation (Sample) | 26.5% | 36.1% |
| Standard Deviation (Population) | 26.2% | 35.3% |
Demographics Similar to Basques and Immigrants from Western Europe by Single Male Poverty
In terms of single male poverty, the demographic groups most similar to Basques are Immigrants from Bangladesh (13.0%, a difference of 0.030%), Estonian (13.0%, a difference of 0.030%), Polish (13.0%, a difference of 0.11%), Northern European (13.0%, a difference of 0.15%), and Sudanese (13.1%, a difference of 0.25%). Similarly, the demographic groups most similar to Immigrants from Western Europe are New Zealander (13.2%, a difference of 0.090%), Central American (13.2%, a difference of 0.11%), Immigrants from Burma/Myanmar (13.1%, a difference of 0.33%), Scandinavian (13.1%, a difference of 0.36%), and Bermudan (13.1%, a difference of 0.38%).
| Demographics | Rating | Rank | Single Male Poverty |
| Basques | 20.7 /100 | #202 | Fair 13.0% |
| Immigrants | Bangladesh | 20.4 /100 | #203 | Fair 13.0% |
| Estonians | 20.3 /100 | #204 | Fair 13.0% |
| Poles | 19.3 /100 | #205 | Poor 13.0% |
| Northern Europeans | 18.9 /100 | #206 | Poor 13.0% |
| Sudanese | 17.7 /100 | #207 | Poor 13.1% |
| Immigrants | Western Africa | 17.6 /100 | #208 | Poor 13.1% |
| Mexican American Indians | 17.5 /100 | #209 | Poor 13.1% |
| Immigrants | Haiti | 16.8 /100 | #210 | Poor 13.1% |
| Swedes | 16.8 /100 | #211 | Poor 13.1% |
| Senegalese | 16.4 /100 | #212 | Poor 13.1% |
| Italians | 15.9 /100 | #213 | Poor 13.1% |
| Zimbabweans | 14.9 /100 | #214 | Poor 13.1% |
| Japanese | 14.8 /100 | #215 | Poor 13.1% |
| Austrians | 13.9 /100 | #216 | Poor 13.1% |
| Bermudans | 13.0 /100 | #217 | Poor 13.1% |
| Scandinavians | 12.9 /100 | #218 | Poor 13.1% |
| Immigrants | Burma/Myanmar | 12.6 /100 | #219 | Poor 13.1% |
| Central Americans | 10.9 /100 | #220 | Poor 13.2% |
| New Zealanders | 10.7 /100 | #221 | Poor 13.2% |
| Immigrants | Western Europe | 10.0 /100 | #222 | Poor 13.2% |