Immigrants from Bulgaria vs Immigrants from Caribbean Receiving Food Stamps
COMPARE
Immigrants from Bulgaria
Immigrants from Caribbean
Receiving Food Stamps
Receiving Food Stamps Comparison
Immigrants from Bulgaria
Immigrants from Caribbean
9.8%
RECEIVING FOOD STAMPS
99.2/ 100
METRIC RATING
62nd/ 347
METRIC RANK
19.6%
RECEIVING FOOD STAMPS
0.0/ 100
METRIC RATING
331st/ 347
METRIC RANK
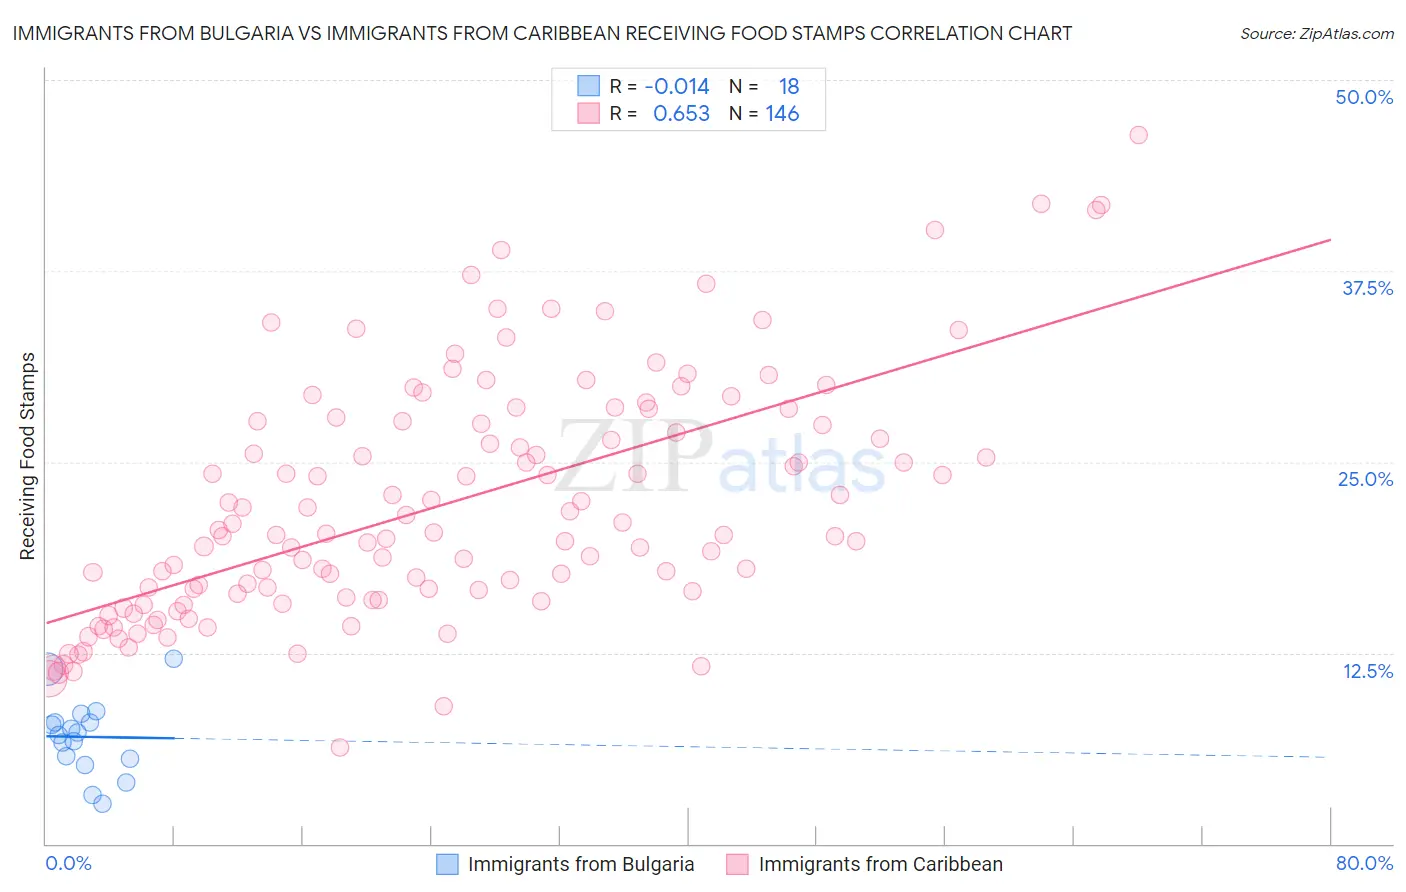
Immigrants from Bulgaria vs Immigrants from Caribbean Receiving Food Stamps Correlation Chart
The statistical analysis conducted on geographies consisting of 172,350,447 people shows no correlation between the proportion of Immigrants from Bulgaria and percentage of population receiving government assistance and/or food stamps in the United States with a correlation coefficient (R) of -0.014 and weighted average of 9.8%. Similarly, the statistical analysis conducted on geographies consisting of 448,445,784 people shows a significant positive correlation between the proportion of Immigrants from Caribbean and percentage of population receiving government assistance and/or food stamps in the United States with a correlation coefficient (R) of 0.653 and weighted average of 19.6%, a difference of 100.8%.
Receiving Food Stamps Correlation Summary
| Measurement | Immigrants from Bulgaria | Immigrants from Caribbean |
| Minimum | 2.6% | 6.3% |
| Maximum | 12.1% | 46.4% |
| Range | 9.5% | 40.1% |
| Mean | 7.0% | 22.2% |
| Median | 7.2% | 20.3% |
| Interquartile 25% (IQ1) | 5.6% | 16.1% |
| Interquartile 75% (IQ3) | 8.0% | 27.7% |
| Interquartile Range (IQR) | 2.4% | 11.5% |
| Standard Deviation (Sample) | 2.5% | 7.8% |
| Standard Deviation (Population) | 2.4% | 7.8% |
Similar Demographics by Receiving Food Stamps
Demographics Similar to Immigrants from Bulgaria by Receiving Food Stamps
In terms of receiving food stamps, the demographic groups most similar to Immigrants from Bulgaria are Chinese (9.8%, a difference of 0.030%), English (9.8%, a difference of 0.080%), Immigrants from North America (9.8%, a difference of 0.12%), German (9.7%, a difference of 0.22%), and Immigrants from Turkey (9.8%, a difference of 0.28%).
| Demographics | Rating | Rank | Receiving Food Stamps |
| Immigrants | Switzerland | 99.3 /100 | #55 | Exceptional 9.7% |
| Immigrants | Canada | 99.3 /100 | #56 | Exceptional 9.7% |
| Greeks | 99.3 /100 | #57 | Exceptional 9.7% |
| Scandinavians | 99.2 /100 | #58 | Exceptional 9.7% |
| British | 99.2 /100 | #59 | Exceptional 9.7% |
| Germans | 99.2 /100 | #60 | Exceptional 9.7% |
| English | 99.2 /100 | #61 | Exceptional 9.8% |
| Immigrants | Bulgaria | 99.2 /100 | #62 | Exceptional 9.8% |
| Chinese | 99.2 /100 | #63 | Exceptional 9.8% |
| Immigrants | North America | 99.2 /100 | #64 | Exceptional 9.8% |
| Immigrants | Turkey | 99.1 /100 | #65 | Exceptional 9.8% |
| Slovenes | 99.1 /100 | #66 | Exceptional 9.8% |
| Immigrants | Indonesia | 99.0 /100 | #67 | Exceptional 9.8% |
| Northern Europeans | 99.0 /100 | #68 | Exceptional 9.8% |
| Italians | 99.0 /100 | #69 | Exceptional 9.9% |
Demographics Similar to Immigrants from Caribbean by Receiving Food Stamps
In terms of receiving food stamps, the demographic groups most similar to Immigrants from Caribbean are Pueblo (19.9%, a difference of 1.5%), Inupiat (20.1%, a difference of 2.2%), Yuman (20.2%, a difference of 3.1%), Pima (19.0%, a difference of 3.4%), and Immigrants from Cuba (20.8%, a difference of 6.2%).
| Demographics | Rating | Rank | Receiving Food Stamps |
| British West Indians | 0.0 /100 | #324 | Tragic 17.9% |
| Immigrants | Haiti | 0.0 /100 | #325 | Tragic 18.2% |
| Cubans | 0.0 /100 | #326 | Tragic 18.2% |
| Apache | 0.0 /100 | #327 | Tragic 18.3% |
| Colville | 0.0 /100 | #328 | Tragic 18.3% |
| Immigrants | Dominica | 0.0 /100 | #329 | Tragic 18.4% |
| Pima | 0.0 /100 | #330 | Tragic 19.0% |
| Immigrants | Caribbean | 0.0 /100 | #331 | Tragic 19.6% |
| Pueblo | 0.0 /100 | #332 | Tragic 19.9% |
| Inupiat | 0.0 /100 | #333 | Tragic 20.1% |
| Yuman | 0.0 /100 | #334 | Tragic 20.2% |
| Immigrants | Cuba | 0.0 /100 | #335 | Tragic 20.8% |
| Navajo | 0.0 /100 | #336 | Tragic 21.1% |
| Cape Verdeans | 0.0 /100 | #337 | Tragic 21.1% |
| Dominicans | 0.0 /100 | #338 | Tragic 21.4% |