Lithuanian vs Immigrants from Dominican Republic Ambulatory Disability
COMPARE
Lithuanian
Immigrants from Dominican Republic
Ambulatory Disability
Ambulatory Disability Comparison
Lithuanians
Immigrants from Dominican Republic
6.0%
AMBULATORY DISABILITY
81.9/ 100
METRIC RATING
149th/ 347
METRIC RANK
7.1%
AMBULATORY DISABILITY
0.0/ 100
METRIC RATING
316th/ 347
METRIC RANK
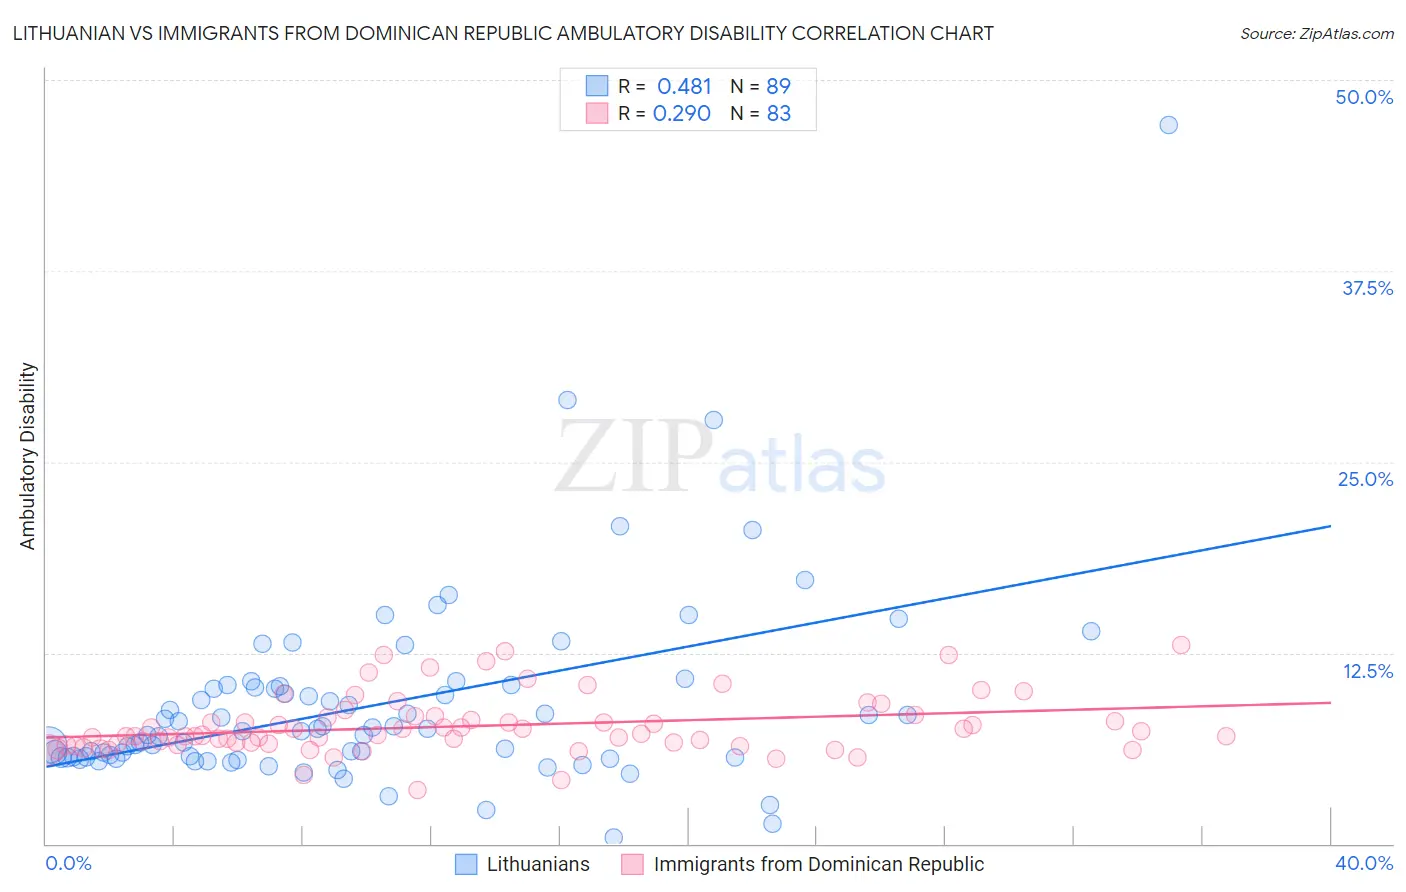
Lithuanian vs Immigrants from Dominican Republic Ambulatory Disability Correlation Chart
The statistical analysis conducted on geographies consisting of 421,829,236 people shows a moderate positive correlation between the proportion of Lithuanians and percentage of population with ambulatory disability in the United States with a correlation coefficient (R) of 0.481 and weighted average of 6.0%. Similarly, the statistical analysis conducted on geographies consisting of 275,045,081 people shows a weak positive correlation between the proportion of Immigrants from Dominican Republic and percentage of population with ambulatory disability in the United States with a correlation coefficient (R) of 0.290 and weighted average of 7.1%, a difference of 19.2%.
Ambulatory Disability Correlation Summary
| Measurement | Lithuanian | Immigrants from Dominican Republic |
| Minimum | 0.40% | 3.5% |
| Maximum | 47.1% | 13.0% |
| Range | 46.7% | 9.5% |
| Mean | 9.0% | 7.7% |
| Median | 7.4% | 7.1% |
| Interquartile 25% (IQ1) | 5.7% | 6.5% |
| Interquartile 75% (IQ3) | 10.3% | 8.3% |
| Interquartile Range (IQR) | 4.6% | 1.8% |
| Standard Deviation (Sample) | 6.3% | 1.9% |
| Standard Deviation (Population) | 6.3% | 1.9% |
Similar Demographics by Ambulatory Disability
Demographics Similar to Lithuanians by Ambulatory Disability
In terms of ambulatory disability, the demographic groups most similar to Lithuanians are Immigrants from Eastern Europe (6.0%, a difference of 0.010%), Maltese (6.0%, a difference of 0.020%), Immigrants from Moldova (6.0%, a difference of 0.050%), Pakistani (6.0%, a difference of 0.060%), and Immigrants from Greece (6.0%, a difference of 0.060%).
| Demographics | Rating | Rank | Ambulatory Disability |
| Immigrants | Philippines | 83.0 /100 | #142 | Excellent 6.0% |
| Romanians | 82.9 /100 | #143 | Excellent 6.0% |
| Macedonians | 82.8 /100 | #144 | Excellent 6.0% |
| Pakistanis | 82.5 /100 | #145 | Excellent 6.0% |
| Immigrants | Greece | 82.5 /100 | #146 | Excellent 6.0% |
| Immigrants | Moldova | 82.4 /100 | #147 | Excellent 6.0% |
| Immigrants | Eastern Europe | 82.0 /100 | #148 | Excellent 6.0% |
| Lithuanians | 81.9 /100 | #149 | Excellent 6.0% |
| Maltese | 81.6 /100 | #150 | Excellent 6.0% |
| Greeks | 79.6 /100 | #151 | Good 6.0% |
| Immigrants | Austria | 78.8 /100 | #152 | Good 6.0% |
| Syrians | 75.5 /100 | #153 | Good 6.0% |
| Immigrants | Croatia | 75.1 /100 | #154 | Good 6.0% |
| Immigrants | Scotland | 72.1 /100 | #155 | Good 6.0% |
| Northern Europeans | 71.8 /100 | #156 | Good 6.0% |
Demographics Similar to Immigrants from Dominican Republic by Ambulatory Disability
In terms of ambulatory disability, the demographic groups most similar to Immigrants from Dominican Republic are Central American Indian (7.2%, a difference of 0.080%), Ottawa (7.2%, a difference of 0.17%), Shoshone (7.1%, a difference of 0.24%), Blackfeet (7.1%, a difference of 0.26%), and Immigrants from Yemen (7.1%, a difference of 0.28%).
| Demographics | Rating | Rank | Ambulatory Disability |
| Immigrants | Azores | 0.0 /100 | #309 | Tragic 7.1% |
| Arapaho | 0.0 /100 | #310 | Tragic 7.1% |
| Cree | 0.0 /100 | #311 | Tragic 7.1% |
| Delaware | 0.0 /100 | #312 | Tragic 7.1% |
| Immigrants | Yemen | 0.0 /100 | #313 | Tragic 7.1% |
| Blackfeet | 0.0 /100 | #314 | Tragic 7.1% |
| Shoshone | 0.0 /100 | #315 | Tragic 7.1% |
| Immigrants | Dominican Republic | 0.0 /100 | #316 | Tragic 7.1% |
| Central American Indians | 0.0 /100 | #317 | Tragic 7.2% |
| Ottawa | 0.0 /100 | #318 | Tragic 7.2% |
| Dominicans | 0.0 /100 | #319 | Tragic 7.2% |
| Potawatomi | 0.0 /100 | #320 | Tragic 7.3% |
| Apache | 0.0 /100 | #321 | Tragic 7.4% |
| Osage | 0.0 /100 | #322 | Tragic 7.4% |
| Americans | 0.0 /100 | #323 | Tragic 7.4% |