Lithuanian vs Immigrants from Latvia Female Poverty Among 25-34 Year Olds
COMPARE
Lithuanian
Immigrants from Latvia
Female Poverty Among 25-34 Year Olds
Female Poverty Among 25-34 Year Olds Comparison
Lithuanians
Immigrants from Latvia
12.2%
FEMALE POVERTY AMONG 25-34 YEAR OLDS
99.1/ 100
METRIC RATING
72nd/ 347
METRIC RANK
12.5%
FEMALE POVERTY AMONG 25-34 YEAR OLDS
97.7/ 100
METRIC RATING
84th/ 347
METRIC RANK
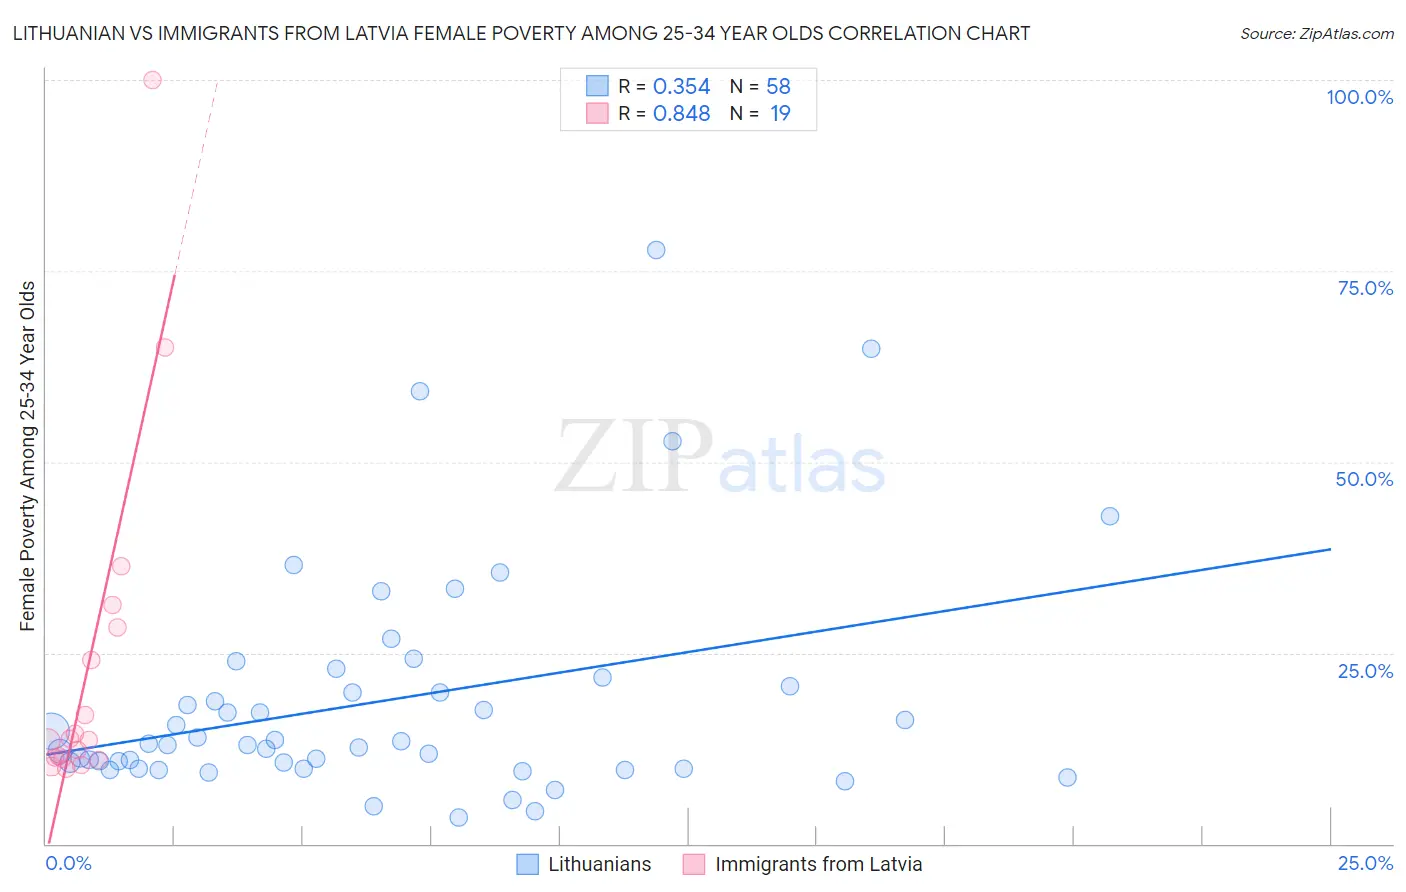
Lithuanian vs Immigrants from Latvia Female Poverty Among 25-34 Year Olds Correlation Chart
The statistical analysis conducted on geographies consisting of 411,639,543 people shows a mild positive correlation between the proportion of Lithuanians and poverty level among females between the ages 25 and 34 in the United States with a correlation coefficient (R) of 0.354 and weighted average of 12.2%. Similarly, the statistical analysis conducted on geographies consisting of 113,031,058 people shows a very strong positive correlation between the proportion of Immigrants from Latvia and poverty level among females between the ages 25 and 34 in the United States with a correlation coefficient (R) of 0.848 and weighted average of 12.5%, a difference of 2.1%.
Female Poverty Among 25-34 Year Olds Correlation Summary
| Measurement | Lithuanian | Immigrants from Latvia |
| Minimum | 3.4% | 9.8% |
| Maximum | 77.8% | 100.0% |
| Range | 74.3% | 90.2% |
| Mean | 18.7% | 23.4% |
| Median | 13.0% | 13.6% |
| Interquartile 25% (IQ1) | 9.9% | 11.1% |
| Interquartile 75% (IQ3) | 20.6% | 28.4% |
| Interquartile Range (IQR) | 10.7% | 17.3% |
| Standard Deviation (Sample) | 15.0% | 23.0% |
| Standard Deviation (Population) | 14.9% | 22.4% |
Demographics Similar to Lithuanians and Immigrants from Latvia by Female Poverty Among 25-34 Year Olds
In terms of female poverty among 25-34 year olds, the demographic groups most similar to Lithuanians are Immigrants from Scotland (12.2%, a difference of 0.050%), Immigrants from Belgium (12.2%, a difference of 0.060%), Immigrants from Lebanon (12.2%, a difference of 0.090%), Sri Lankan (12.2%, a difference of 0.12%), and Immigrants from Vietnam (12.3%, a difference of 0.31%). Similarly, the demographic groups most similar to Immigrants from Latvia are Albanian (12.5%, a difference of 0.060%), Immigrants from South Eastern Asia (12.5%, a difference of 0.11%), Croatian (12.5%, a difference of 0.13%), Argentinean (12.5%, a difference of 0.15%), and Immigrants from Austria (12.5%, a difference of 0.23%).
| Demographics | Rating | Rank | Female Poverty Among 25-34 Year Olds |
| Sri Lankans | 99.1 /100 | #68 | Exceptional 12.2% |
| Immigrants | Lebanon | 99.1 /100 | #69 | Exceptional 12.2% |
| Immigrants | Belgium | 99.1 /100 | #70 | Exceptional 12.2% |
| Immigrants | Scotland | 99.1 /100 | #71 | Exceptional 12.2% |
| Lithuanians | 99.1 /100 | #72 | Exceptional 12.2% |
| Immigrants | Vietnam | 98.9 /100 | #73 | Exceptional 12.3% |
| Immigrants | Sweden | 98.9 /100 | #74 | Exceptional 12.3% |
| Estonians | 98.9 /100 | #75 | Exceptional 12.3% |
| Greeks | 98.9 /100 | #76 | Exceptional 12.3% |
| Immigrants | Italy | 98.8 /100 | #77 | Exceptional 12.3% |
| Immigrants | Ukraine | 98.6 /100 | #78 | Exceptional 12.3% |
| Immigrants | Jordan | 98.5 /100 | #79 | Exceptional 12.4% |
| Immigrants | Malaysia | 98.3 /100 | #80 | Exceptional 12.4% |
| Immigrants | Kazakhstan | 98.1 /100 | #81 | Exceptional 12.4% |
| Ethiopians | 98.0 /100 | #82 | Exceptional 12.4% |
| Albanians | 97.7 /100 | #83 | Exceptional 12.5% |
| Immigrants | Latvia | 97.7 /100 | #84 | Exceptional 12.5% |
| Immigrants | South Eastern Asia | 97.6 /100 | #85 | Exceptional 12.5% |
| Croatians | 97.5 /100 | #86 | Exceptional 12.5% |
| Argentineans | 97.5 /100 | #87 | Exceptional 12.5% |
| Immigrants | Austria | 97.4 /100 | #88 | Exceptional 12.5% |