Immigrants from Canada vs Danish Female Poverty
COMPARE
Immigrants from Canada
Danish
Female Poverty
Female Poverty Comparison
Immigrants from Canada
Danes
12.3%
FEMALE POVERTY
97.5/ 100
METRIC RATING
74th/ 347
METRIC RANK
11.7%
FEMALE POVERTY
99.5/ 100
METRIC RATING
32nd/ 347
METRIC RANK
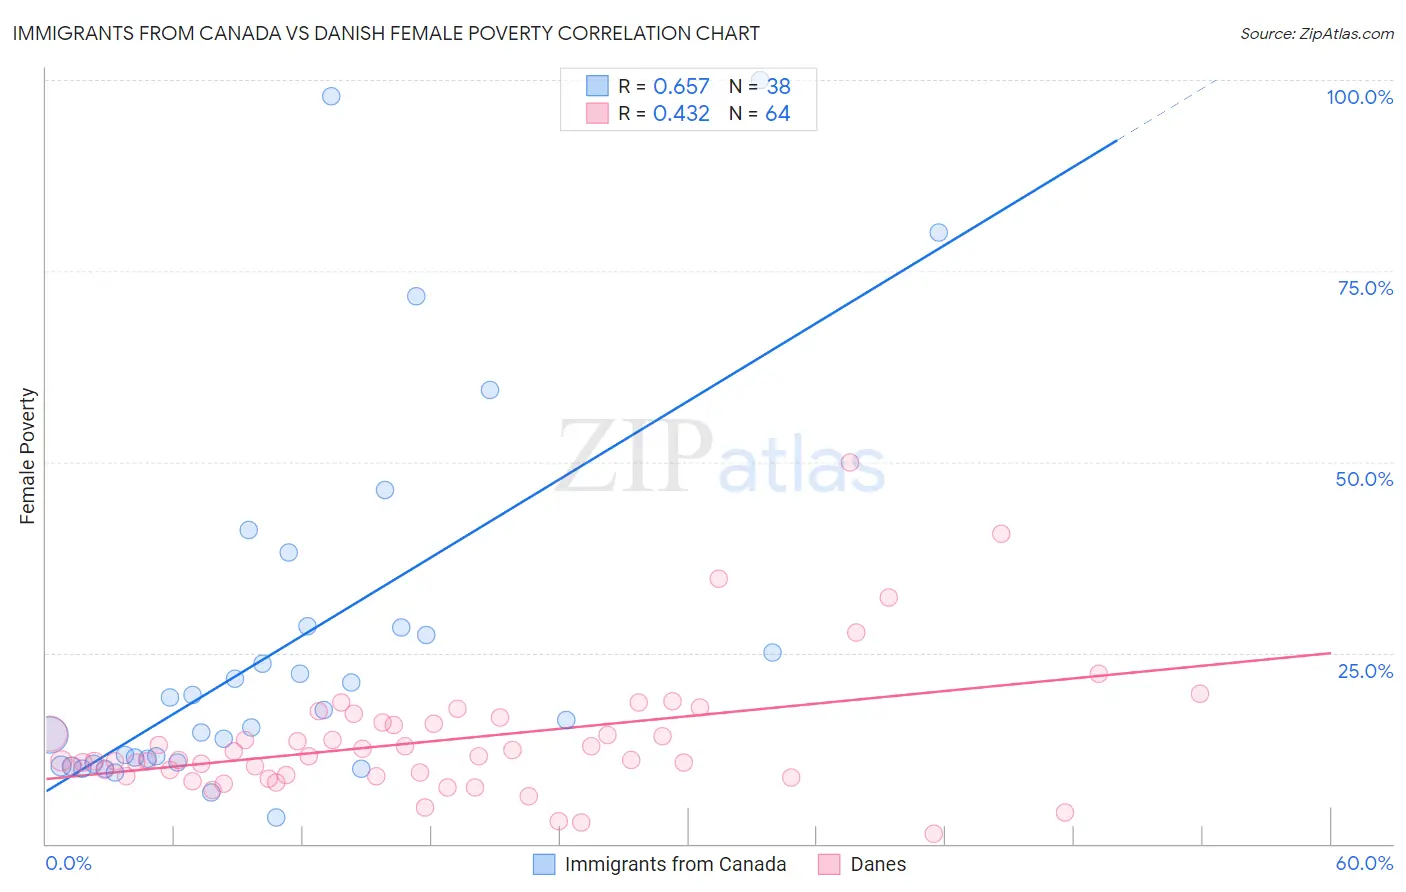
Immigrants from Canada vs Danish Female Poverty Correlation Chart
The statistical analysis conducted on geographies consisting of 458,964,153 people shows a significant positive correlation between the proportion of Immigrants from Canada and poverty level among females in the United States with a correlation coefficient (R) of 0.657 and weighted average of 12.3%. Similarly, the statistical analysis conducted on geographies consisting of 473,673,857 people shows a moderate positive correlation between the proportion of Danes and poverty level among females in the United States with a correlation coefficient (R) of 0.432 and weighted average of 11.7%, a difference of 4.3%.
Female Poverty Correlation Summary
| Measurement | Immigrants from Canada | Danish |
| Minimum | 3.5% | 1.4% |
| Maximum | 100.0% | 50.0% |
| Range | 96.5% | 48.6% |
| Mean | 26.2% | 13.5% |
| Median | 16.9% | 11.2% |
| Interquartile 25% (IQ1) | 10.6% | 8.9% |
| Interquartile 75% (IQ3) | 28.3% | 15.8% |
| Interquartile Range (IQR) | 17.8% | 6.9% |
| Standard Deviation (Sample) | 24.5% | 8.4% |
| Standard Deviation (Population) | 24.2% | 8.3% |
Similar Demographics by Female Poverty
Demographics Similar to Immigrants from Canada by Female Poverty
In terms of female poverty, the demographic groups most similar to Immigrants from Canada are Zimbabwean (12.3%, a difference of 0.010%), Cambodian (12.2%, a difference of 0.030%), Carpatho Rusyn (12.2%, a difference of 0.060%), European (12.3%, a difference of 0.12%), and Immigrants from Belgium (12.2%, a difference of 0.19%).
| Demographics | Rating | Rank | Female Poverty |
| Immigrants | Eastern Asia | 97.8 /100 | #67 | Exceptional 12.2% |
| Immigrants | Netherlands | 97.8 /100 | #68 | Exceptional 12.2% |
| Swiss | 97.7 /100 | #69 | Exceptional 12.2% |
| Immigrants | Belgium | 97.7 /100 | #70 | Exceptional 12.2% |
| Carpatho Rusyns | 97.6 /100 | #71 | Exceptional 12.2% |
| Cambodians | 97.5 /100 | #72 | Exceptional 12.2% |
| Zimbabweans | 97.5 /100 | #73 | Exceptional 12.3% |
| Immigrants | Canada | 97.5 /100 | #74 | Exceptional 12.3% |
| Europeans | 97.4 /100 | #75 | Exceptional 12.3% |
| Immigrants | Eastern Europe | 97.2 /100 | #76 | Exceptional 12.3% |
| Serbians | 97.2 /100 | #77 | Exceptional 12.3% |
| Egyptians | 97.2 /100 | #78 | Exceptional 12.3% |
| Immigrants | North America | 97.1 /100 | #79 | Exceptional 12.3% |
| Slovaks | 97.1 /100 | #80 | Exceptional 12.3% |
| Immigrants | Sweden | 97.1 /100 | #81 | Exceptional 12.3% |
Demographics Similar to Danes by Female Poverty
In terms of female poverty, the demographic groups most similar to Danes are Cypriot (11.8%, a difference of 0.070%), Polish (11.7%, a difference of 0.13%), Immigrants from Singapore (11.8%, a difference of 0.19%), Greek (11.7%, a difference of 0.35%), and Immigrants from Iran (11.8%, a difference of 0.36%).
| Demographics | Rating | Rank | Female Poverty |
| Immigrants | Northern Europe | 99.6 /100 | #25 | Exceptional 11.6% |
| Croatians | 99.6 /100 | #26 | Exceptional 11.6% |
| Iranians | 99.6 /100 | #27 | Exceptional 11.7% |
| Immigrants | Korea | 99.6 /100 | #28 | Exceptional 11.7% |
| Immigrants | North Macedonia | 99.6 /100 | #29 | Exceptional 11.7% |
| Greeks | 99.5 /100 | #30 | Exceptional 11.7% |
| Poles | 99.5 /100 | #31 | Exceptional 11.7% |
| Danes | 99.5 /100 | #32 | Exceptional 11.7% |
| Cypriots | 99.5 /100 | #33 | Exceptional 11.8% |
| Immigrants | Singapore | 99.4 /100 | #34 | Exceptional 11.8% |
| Immigrants | Iran | 99.4 /100 | #35 | Exceptional 11.8% |
| Immigrants | Pakistan | 99.4 /100 | #36 | Exceptional 11.8% |
| Immigrants | Greece | 99.3 /100 | #37 | Exceptional 11.8% |
| Russians | 99.3 /100 | #38 | Exceptional 11.8% |
| Immigrants | Poland | 99.3 /100 | #39 | Exceptional 11.8% |