Liberian vs Immigrants from Kenya Divorced or Separated
COMPARE
Liberian
Immigrants from Kenya
Divorced or Separated
Divorced or Separated Comparison
Liberians
Immigrants from Kenya
12.6%
DIVORCED OR SEPARATED
0.9/ 100
METRIC RATING
252nd/ 347
METRIC RANK
12.2%
DIVORCED OR SEPARATED
16.5/ 100
METRIC RATING
212th/ 347
METRIC RANK
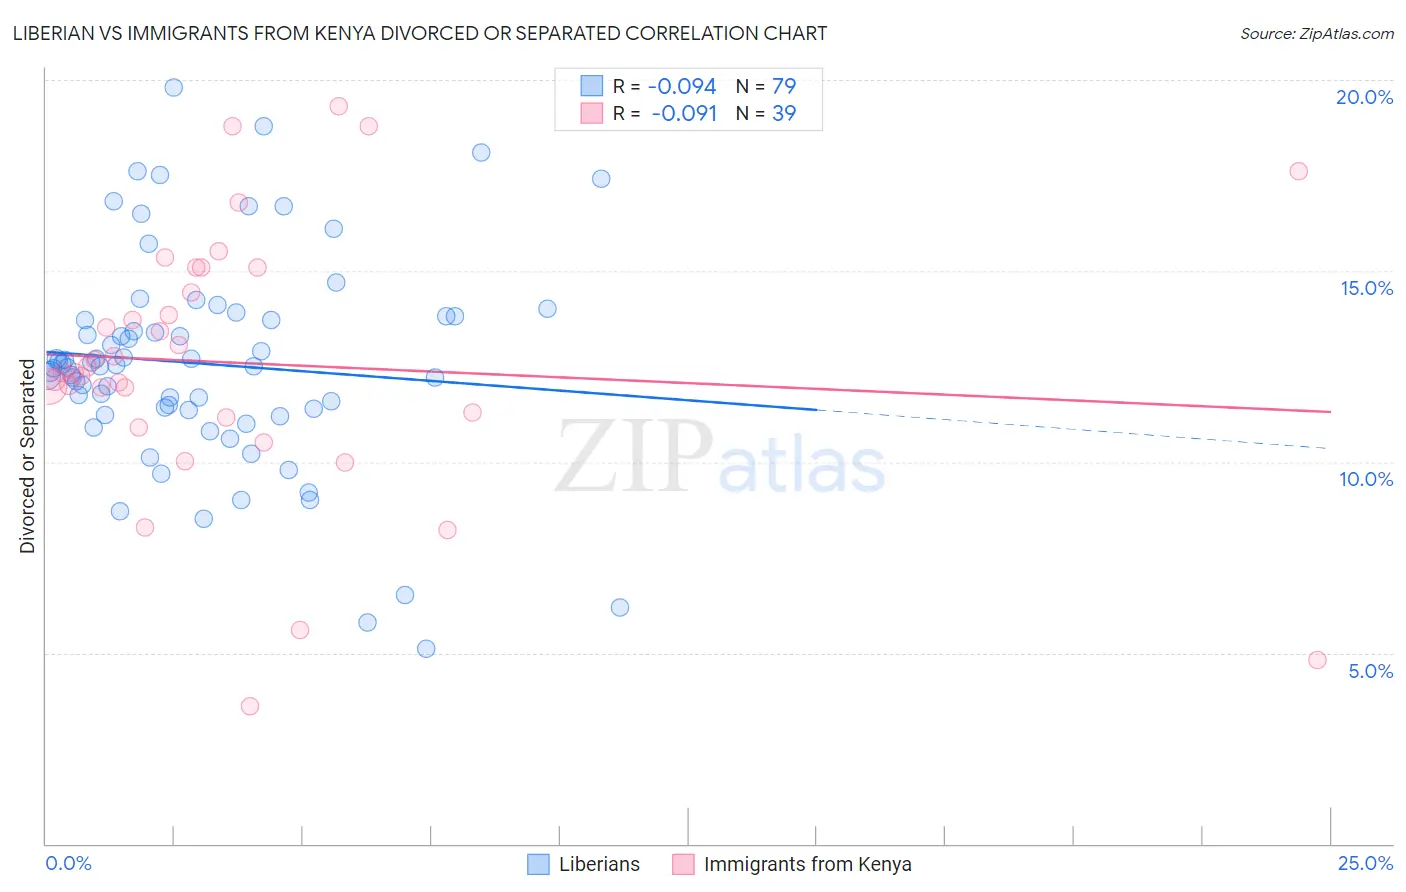
Liberian vs Immigrants from Kenya Divorced or Separated Correlation Chart
The statistical analysis conducted on geographies consisting of 118,063,038 people shows a slight negative correlation between the proportion of Liberians and percentage of population currently divorced or separated in the United States with a correlation coefficient (R) of -0.094 and weighted average of 12.6%. Similarly, the statistical analysis conducted on geographies consisting of 218,023,552 people shows a slight negative correlation between the proportion of Immigrants from Kenya and percentage of population currently divorced or separated in the United States with a correlation coefficient (R) of -0.091 and weighted average of 12.2%, a difference of 2.7%.
Divorced or Separated Correlation Summary
| Measurement | Liberian | Immigrants from Kenya |
| Minimum | 5.1% | 3.6% |
| Maximum | 19.8% | 19.3% |
| Range | 14.7% | 15.7% |
| Mean | 12.6% | 12.6% |
| Median | 12.5% | 12.3% |
| Interquartile 25% (IQ1) | 11.3% | 11.2% |
| Interquartile 75% (IQ3) | 13.8% | 15.1% |
| Interquartile Range (IQR) | 2.5% | 3.9% |
| Standard Deviation (Sample) | 2.8% | 3.5% |
| Standard Deviation (Population) | 2.8% | 3.4% |
Similar Demographics by Divorced or Separated
Demographics Similar to Liberians by Divorced or Separated
In terms of divorced or separated, the demographic groups most similar to Liberians are Somali (12.6%, a difference of 0.0%), Senegalese (12.6%, a difference of 0.060%), Welsh (12.6%, a difference of 0.16%), Immigrants from Colombia (12.6%, a difference of 0.32%), and Irish (12.5%, a difference of 0.33%).
| Demographics | Rating | Rank | Divorced or Separated |
| Hispanics or Latinos | 2.0 /100 | #245 | Tragic 12.5% |
| Immigrants | West Indies | 1.9 /100 | #246 | Tragic 12.5% |
| Germans | 1.8 /100 | #247 | Tragic 12.5% |
| Nepalese | 1.8 /100 | #248 | Tragic 12.5% |
| Finns | 1.8 /100 | #249 | Tragic 12.5% |
| Irish | 1.3 /100 | #250 | Tragic 12.5% |
| Aleuts | 1.3 /100 | #251 | Tragic 12.5% |
| Liberians | 0.9 /100 | #252 | Tragic 12.6% |
| Somalis | 0.9 /100 | #253 | Tragic 12.6% |
| Senegalese | 0.8 /100 | #254 | Tragic 12.6% |
| Welsh | 0.7 /100 | #255 | Tragic 12.6% |
| Immigrants | Colombia | 0.6 /100 | #256 | Tragic 12.6% |
| Immigrants | Somalia | 0.6 /100 | #257 | Tragic 12.6% |
| Indonesians | 0.6 /100 | #258 | Tragic 12.6% |
| Yuman | 0.6 /100 | #259 | Tragic 12.6% |
Demographics Similar to Immigrants from Kenya by Divorced or Separated
In terms of divorced or separated, the demographic groups most similar to Immigrants from Kenya are Trinidadian and Tobagonian (12.2%, a difference of 0.010%), Immigrants from Eastern Africa (12.2%, a difference of 0.020%), Slavic (12.2%, a difference of 0.030%), Immigrants from Argentina (12.2%, a difference of 0.060%), and European (12.2%, a difference of 0.070%).
| Demographics | Rating | Rank | Divorced or Separated |
| Immigrants | Costa Rica | 21.3 /100 | #205 | Fair 12.2% |
| Slovaks | 21.0 /100 | #206 | Fair 12.2% |
| Mexicans | 21.0 /100 | #207 | Fair 12.2% |
| Immigrants | Ghana | 18.8 /100 | #208 | Poor 12.2% |
| Immigrants | Trinidad and Tobago | 17.8 /100 | #209 | Poor 12.2% |
| Slavs | 17.0 /100 | #210 | Poor 12.2% |
| Trinidadians and Tobagonians | 16.6 /100 | #211 | Poor 12.2% |
| Immigrants | Kenya | 16.5 /100 | #212 | Poor 12.2% |
| Immigrants | Eastern Africa | 16.2 /100 | #213 | Poor 12.2% |
| Immigrants | Argentina | 15.5 /100 | #214 | Poor 12.2% |
| Europeans | 15.4 /100 | #215 | Poor 12.2% |
| Immigrants | South America | 15.4 /100 | #216 | Poor 12.2% |
| Northern Europeans | 14.7 /100 | #217 | Poor 12.2% |
| Slovenes | 13.2 /100 | #218 | Poor 12.3% |
| Czechoslovakians | 11.7 /100 | #219 | Poor 12.3% |