Laotian vs Sudanese Female Poverty
COMPARE
Laotian
Sudanese
Female Poverty
Female Poverty Comparison
Laotians
Sudanese
12.6%
FEMALE POVERTY
93.4/ 100
METRIC RATING
107th/ 347
METRIC RANK
15.2%
FEMALE POVERTY
0.5/ 100
METRIC RATING
240th/ 347
METRIC RANK
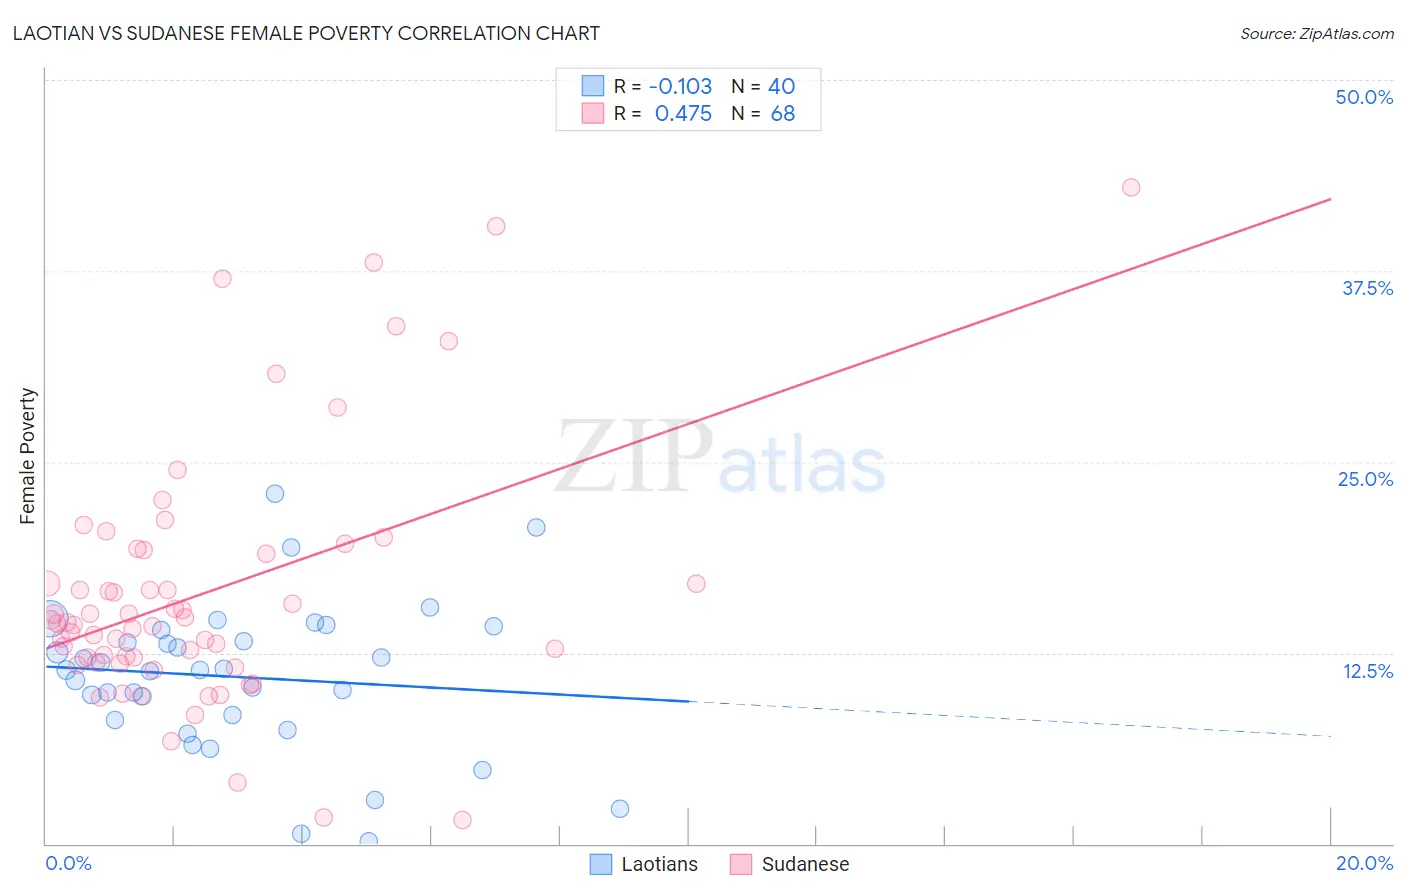
Laotian vs Sudanese Female Poverty Correlation Chart
The statistical analysis conducted on geographies consisting of 224,727,554 people shows a poor negative correlation between the proportion of Laotians and poverty level among females in the United States with a correlation coefficient (R) of -0.103 and weighted average of 12.6%. Similarly, the statistical analysis conducted on geographies consisting of 110,113,357 people shows a moderate positive correlation between the proportion of Sudanese and poverty level among females in the United States with a correlation coefficient (R) of 0.475 and weighted average of 15.2%, a difference of 20.6%.
Female Poverty Correlation Summary
| Measurement | Laotian | Sudanese |
| Minimum | 0.15% | 1.6% |
| Maximum | 22.9% | 43.0% |
| Range | 22.8% | 41.4% |
| Mean | 10.9% | 16.5% |
| Median | 11.4% | 14.4% |
| Interquartile 25% (IQ1) | 8.3% | 12.0% |
| Interquartile 75% (IQ3) | 13.6% | 19.1% |
| Interquartile Range (IQR) | 5.3% | 7.1% |
| Standard Deviation (Sample) | 4.8% | 8.3% |
| Standard Deviation (Population) | 4.8% | 8.3% |
Similar Demographics by Female Poverty
Demographics Similar to Laotians by Female Poverty
In terms of female poverty, the demographic groups most similar to Laotians are Portuguese (12.6%, a difference of 0.10%), Immigrants from Zimbabwe (12.6%, a difference of 0.12%), Paraguayan (12.6%, a difference of 0.15%), Immigrants from Turkey (12.6%, a difference of 0.19%), and Scottish (12.5%, a difference of 0.31%).
| Demographics | Rating | Rank | Female Poverty |
| Immigrants | Latvia | 94.8 /100 | #100 | Exceptional 12.5% |
| Tlingit-Haida | 94.8 /100 | #101 | Exceptional 12.5% |
| Immigrants | China | 94.5 /100 | #102 | Exceptional 12.5% |
| Slavs | 94.5 /100 | #103 | Exceptional 12.5% |
| Palestinians | 94.3 /100 | #104 | Exceptional 12.5% |
| Scottish | 94.1 /100 | #105 | Exceptional 12.5% |
| Immigrants | Turkey | 93.8 /100 | #106 | Exceptional 12.6% |
| Laotians | 93.4 /100 | #107 | Exceptional 12.6% |
| Portuguese | 93.1 /100 | #108 | Exceptional 12.6% |
| Immigrants | Zimbabwe | 93.1 /100 | #109 | Exceptional 12.6% |
| Paraguayans | 93.0 /100 | #110 | Exceptional 12.6% |
| Soviet Union | 92.4 /100 | #111 | Exceptional 12.6% |
| Immigrants | Israel | 92.0 /100 | #112 | Exceptional 12.6% |
| Canadians | 92.0 /100 | #113 | Exceptional 12.7% |
| Welsh | 91.6 /100 | #114 | Exceptional 12.7% |
Demographics Similar to Sudanese by Female Poverty
In terms of female poverty, the demographic groups most similar to Sudanese are Immigrants from Middle Africa (15.2%, a difference of 0.050%), Immigrants from Sudan (15.2%, a difference of 0.25%), Nepalese (15.2%, a difference of 0.37%), Immigrants from Armenia (15.1%, a difference of 0.57%), and Nicaraguan (15.3%, a difference of 0.61%).
| Demographics | Rating | Rank | Female Poverty |
| Immigrants | Saudi Arabia | 1.4 /100 | #233 | Tragic 14.8% |
| Fijians | 1.1 /100 | #234 | Tragic 14.9% |
| Immigrants | Laos | 0.9 /100 | #235 | Tragic 15.0% |
| Cree | 0.7 /100 | #236 | Tragic 15.1% |
| French American Indians | 0.6 /100 | #237 | Tragic 15.1% |
| Immigrants | Armenia | 0.6 /100 | #238 | Tragic 15.1% |
| Immigrants | Middle Africa | 0.5 /100 | #239 | Tragic 15.2% |
| Sudanese | 0.5 /100 | #240 | Tragic 15.2% |
| Immigrants | Sudan | 0.4 /100 | #241 | Tragic 15.2% |
| Nepalese | 0.4 /100 | #242 | Tragic 15.2% |
| Nicaraguans | 0.3 /100 | #243 | Tragic 15.3% |
| Ecuadorians | 0.3 /100 | #244 | Tragic 15.3% |
| Spanish American Indians | 0.3 /100 | #245 | Tragic 15.3% |
| Cubans | 0.3 /100 | #246 | Tragic 15.3% |
| Potawatomi | 0.3 /100 | #247 | Tragic 15.3% |