English vs Sudanese Female Poverty
COMPARE
English
Sudanese
Female Poverty
Female Poverty Comparison
English
Sudanese
12.4%
FEMALE POVERTY
96.1/ 100
METRIC RATING
89th/ 347
METRIC RANK
15.2%
FEMALE POVERTY
0.5/ 100
METRIC RATING
240th/ 347
METRIC RANK
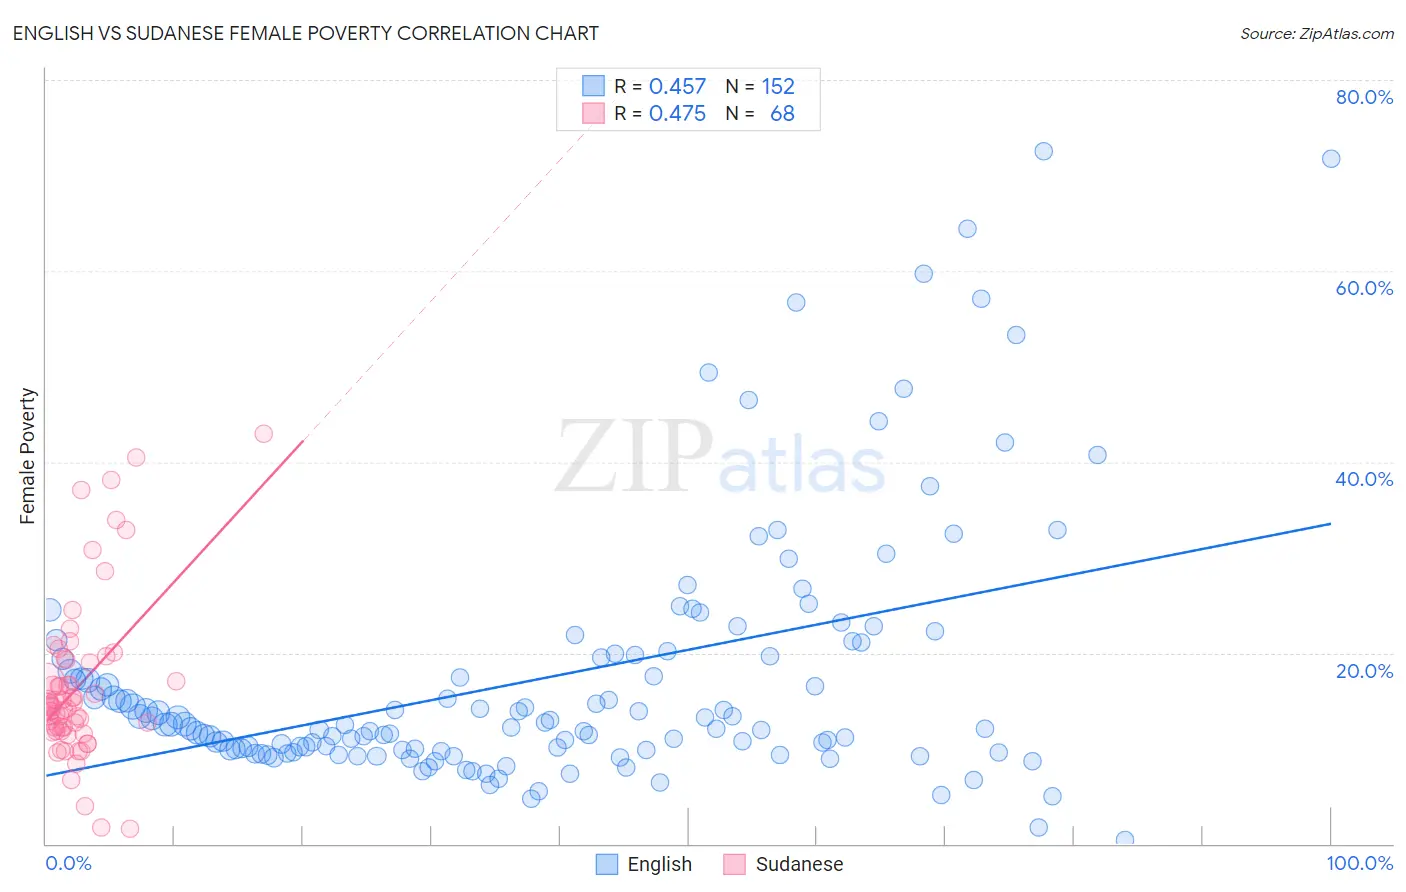
English vs Sudanese Female Poverty Correlation Chart
The statistical analysis conducted on geographies consisting of 578,145,061 people shows a moderate positive correlation between the proportion of English and poverty level among females in the United States with a correlation coefficient (R) of 0.457 and weighted average of 12.4%. Similarly, the statistical analysis conducted on geographies consisting of 110,113,357 people shows a moderate positive correlation between the proportion of Sudanese and poverty level among females in the United States with a correlation coefficient (R) of 0.475 and weighted average of 15.2%, a difference of 22.4%.
Female Poverty Correlation Summary
| Measurement | English | Sudanese |
| Minimum | 0.38% | 1.6% |
| Maximum | 72.5% | 43.0% |
| Range | 72.2% | 41.4% |
| Mean | 17.3% | 16.5% |
| Median | 12.4% | 14.4% |
| Interquartile 25% (IQ1) | 9.8% | 12.0% |
| Interquartile 75% (IQ3) | 19.7% | 19.1% |
| Interquartile Range (IQR) | 9.9% | 7.1% |
| Standard Deviation (Sample) | 13.4% | 8.3% |
| Standard Deviation (Population) | 13.3% | 8.3% |
Similar Demographics by Female Poverty
Demographics Similar to English by Female Poverty
In terms of female poverty, the demographic groups most similar to English are Finnish (12.4%, a difference of 0.20%), Immigrants from Denmark (12.4%, a difference of 0.22%), Belgian (12.4%, a difference of 0.23%), Okinawan (12.4%, a difference of 0.24%), and Czechoslovakian (12.4%, a difference of 0.24%).
| Demographics | Rating | Rank | Female Poverty |
| Jordanians | 97.1 /100 | #82 | Exceptional 12.3% |
| Immigrants | England | 96.9 /100 | #83 | Exceptional 12.3% |
| Northern Europeans | 96.6 /100 | #84 | Exceptional 12.4% |
| Irish | 96.5 /100 | #85 | Exceptional 12.4% |
| Dutch | 96.5 /100 | #86 | Exceptional 12.4% |
| Okinawans | 96.4 /100 | #87 | Exceptional 12.4% |
| Finns | 96.4 /100 | #88 | Exceptional 12.4% |
| English | 96.1 /100 | #89 | Exceptional 12.4% |
| Immigrants | Denmark | 95.8 /100 | #90 | Exceptional 12.4% |
| Belgians | 95.8 /100 | #91 | Exceptional 12.4% |
| Czechoslovakians | 95.7 /100 | #92 | Exceptional 12.4% |
| Immigrants | Egypt | 95.5 /100 | #93 | Exceptional 12.5% |
| Immigrants | Indonesia | 95.4 /100 | #94 | Exceptional 12.5% |
| Immigrants | South Africa | 95.4 /100 | #95 | Exceptional 12.5% |
| British | 95.2 /100 | #96 | Exceptional 12.5% |
Demographics Similar to Sudanese by Female Poverty
In terms of female poverty, the demographic groups most similar to Sudanese are Immigrants from Middle Africa (15.2%, a difference of 0.050%), Immigrants from Sudan (15.2%, a difference of 0.25%), Nepalese (15.2%, a difference of 0.37%), Immigrants from Armenia (15.1%, a difference of 0.57%), and Nicaraguan (15.3%, a difference of 0.61%).
| Demographics | Rating | Rank | Female Poverty |
| Immigrants | Saudi Arabia | 1.4 /100 | #233 | Tragic 14.8% |
| Fijians | 1.1 /100 | #234 | Tragic 14.9% |
| Immigrants | Laos | 0.9 /100 | #235 | Tragic 15.0% |
| Cree | 0.7 /100 | #236 | Tragic 15.1% |
| French American Indians | 0.6 /100 | #237 | Tragic 15.1% |
| Immigrants | Armenia | 0.6 /100 | #238 | Tragic 15.1% |
| Immigrants | Middle Africa | 0.5 /100 | #239 | Tragic 15.2% |
| Sudanese | 0.5 /100 | #240 | Tragic 15.2% |
| Immigrants | Sudan | 0.4 /100 | #241 | Tragic 15.2% |
| Nepalese | 0.4 /100 | #242 | Tragic 15.2% |
| Nicaraguans | 0.3 /100 | #243 | Tragic 15.3% |
| Ecuadorians | 0.3 /100 | #244 | Tragic 15.3% |
| Spanish American Indians | 0.3 /100 | #245 | Tragic 15.3% |
| Cubans | 0.3 /100 | #246 | Tragic 15.3% |
| Potawatomi | 0.3 /100 | #247 | Tragic 15.3% |