Laotian vs Italian Family Poverty
COMPARE
Laotian
Italian
Family Poverty
Family Poverty Comparison
Laotians
Italians
8.1%
FAMILY POVERTY
95.6/ 100
METRIC RATING
105th/ 347
METRIC RANK
7.4%
FAMILY POVERTY
99.6/ 100
METRIC RATING
30th/ 347
METRIC RANK
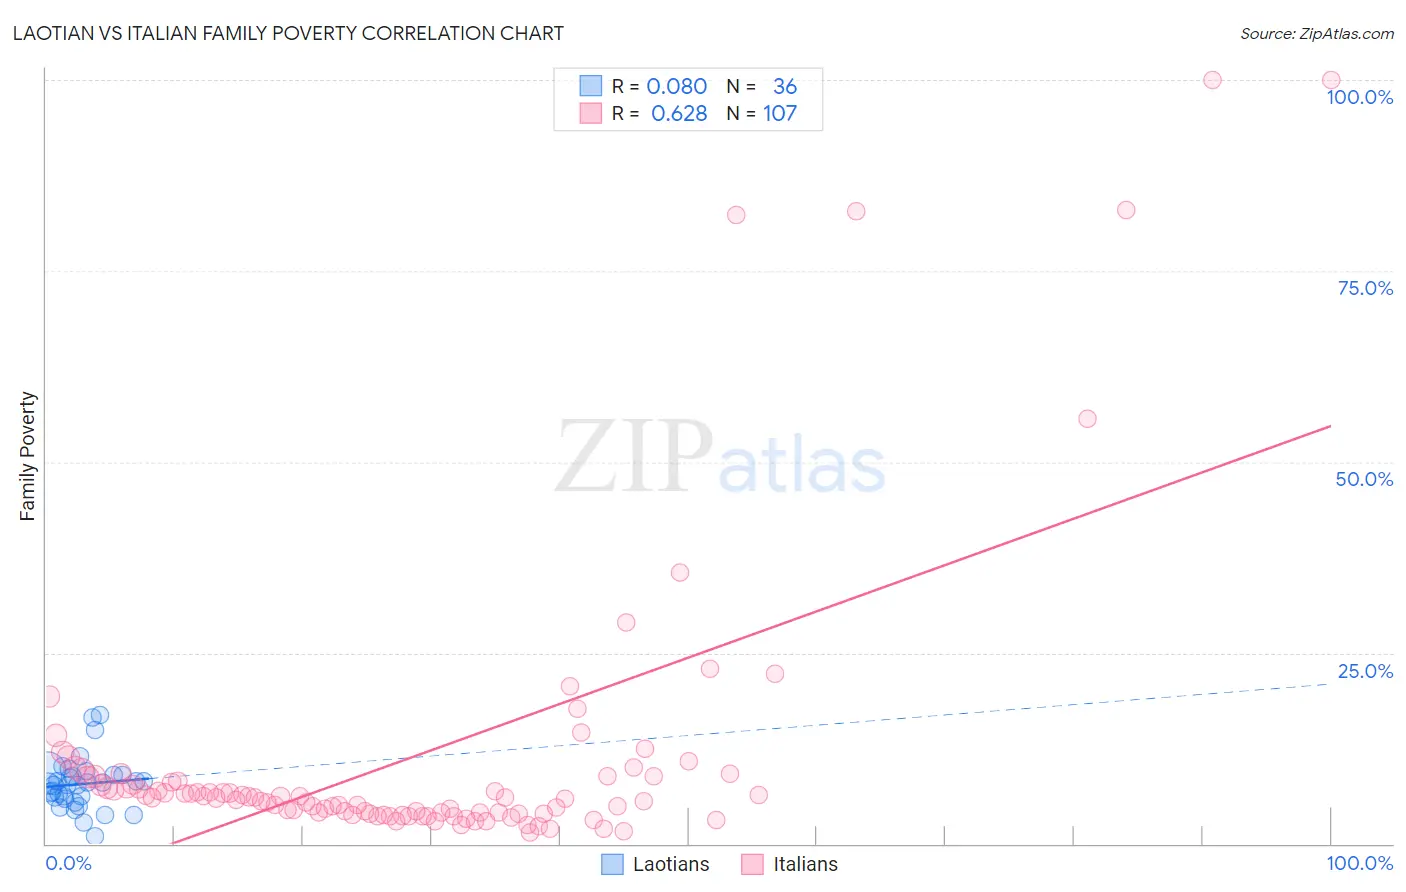
Laotian vs Italian Family Poverty Correlation Chart
The statistical analysis conducted on geographies consisting of 224,550,821 people shows a slight positive correlation between the proportion of Laotians and poverty level among families in the United States with a correlation coefficient (R) of 0.080 and weighted average of 8.1%. Similarly, the statistical analysis conducted on geographies consisting of 569,861,523 people shows a significant positive correlation between the proportion of Italians and poverty level among families in the United States with a correlation coefficient (R) of 0.628 and weighted average of 7.4%, a difference of 9.4%.
Family Poverty Correlation Summary
| Measurement | Laotian | Italian |
| Minimum | 0.98% | 1.5% |
| Maximum | 16.8% | 100.0% |
| Range | 15.9% | 98.5% |
| Mean | 7.8% | 11.4% |
| Median | 7.8% | 6.1% |
| Interquartile 25% (IQ1) | 6.0% | 4.0% |
| Interquartile 75% (IQ3) | 9.0% | 8.8% |
| Interquartile Range (IQR) | 3.1% | 4.8% |
| Standard Deviation (Sample) | 3.4% | 18.9% |
| Standard Deviation (Population) | 3.3% | 18.8% |
Similar Demographics by Family Poverty
Demographics Similar to Laotians by Family Poverty
In terms of family poverty, the demographic groups most similar to Laotians are Slavic (8.1%, a difference of 0.030%), Immigrants from Eastern Europe (8.1%, a difference of 0.040%), Immigrants from Indonesia (8.1%, a difference of 0.13%), Immigrants from Norway (8.1%, a difference of 0.14%), and New Zealander (8.1%, a difference of 0.17%).
| Demographics | Rating | Rank | Family Poverty |
| Immigrants | South Africa | 95.9 /100 | #98 | Exceptional 8.1% |
| Welsh | 95.8 /100 | #99 | Exceptional 8.1% |
| New Zealanders | 95.8 /100 | #100 | Exceptional 8.1% |
| Immigrants | Norway | 95.7 /100 | #101 | Exceptional 8.1% |
| Immigrants | Indonesia | 95.7 /100 | #102 | Exceptional 8.1% |
| Immigrants | Eastern Europe | 95.6 /100 | #103 | Exceptional 8.1% |
| Slavs | 95.6 /100 | #104 | Exceptional 8.1% |
| Laotians | 95.6 /100 | #105 | Exceptional 8.1% |
| Egyptians | 95.1 /100 | #106 | Exceptional 8.1% |
| French Canadians | 95.0 /100 | #107 | Exceptional 8.1% |
| Basques | 94.9 /100 | #108 | Exceptional 8.1% |
| Jordanians | 94.8 /100 | #109 | Exceptional 8.2% |
| Romanians | 94.7 /100 | #110 | Exceptional 8.2% |
| Taiwanese | 94.6 /100 | #111 | Exceptional 8.2% |
| Immigrants | France | 94.4 /100 | #112 | Exceptional 8.2% |
Demographics Similar to Italians by Family Poverty
In terms of family poverty, the demographic groups most similar to Italians are Czech (7.4%, a difference of 0.12%), Immigrants from Northern Europe (7.4%, a difference of 0.29%), Polish (7.4%, a difference of 0.42%), Immigrants from Japan (7.4%, a difference of 0.42%), and Immigrants from Korea (7.4%, a difference of 0.46%).
| Demographics | Rating | Rank | Family Poverty |
| Assyrians/Chaldeans/Syriacs | 99.7 /100 | #23 | Exceptional 7.3% |
| Croatians | 99.7 /100 | #24 | Exceptional 7.3% |
| Burmese | 99.7 /100 | #25 | Exceptional 7.3% |
| Cypriots | 99.6 /100 | #26 | Exceptional 7.3% |
| Immigrants | Scotland | 99.6 /100 | #27 | Exceptional 7.3% |
| Immigrants | Korea | 99.6 /100 | #28 | Exceptional 7.4% |
| Immigrants | Northern Europe | 99.6 /100 | #29 | Exceptional 7.4% |
| Italians | 99.6 /100 | #30 | Exceptional 7.4% |
| Czechs | 99.6 /100 | #31 | Exceptional 7.4% |
| Poles | 99.5 /100 | #32 | Exceptional 7.4% |
| Immigrants | Japan | 99.5 /100 | #33 | Exceptional 7.4% |
| Russians | 99.5 /100 | #34 | Exceptional 7.5% |
| Greeks | 99.4 /100 | #35 | Exceptional 7.5% |
| Turks | 99.4 /100 | #36 | Exceptional 7.5% |
| Estonians | 99.4 /100 | #37 | Exceptional 7.5% |