Laotian vs Italian Family Households with Children
COMPARE
Laotian
Italian
Family Households with Children
Family Households with Children Comparison
Laotians
Italians
28.5%
FAMILY HOUSEHOLDS WITH CHILDREN
99.9/ 100
METRIC RATING
74th/ 347
METRIC RANK
26.8%
FAMILY HOUSEHOLDS WITH CHILDREN
1.5/ 100
METRIC RATING
253rd/ 347
METRIC RANK
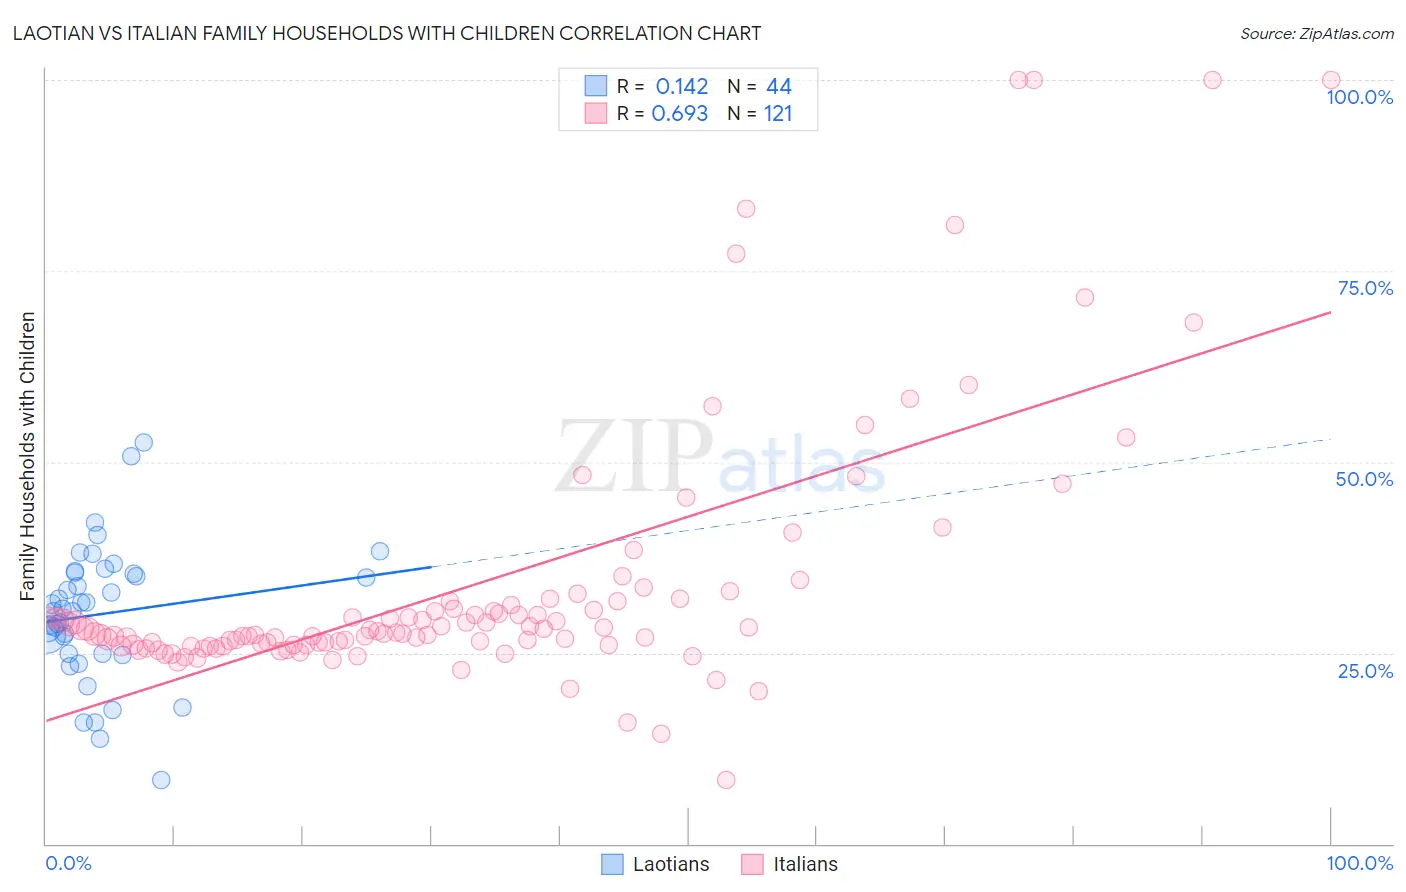
Laotian vs Italian Family Households with Children Correlation Chart
The statistical analysis conducted on geographies consisting of 224,687,368 people shows a poor positive correlation between the proportion of Laotians and percentage of family households with children in the United States with a correlation coefficient (R) of 0.142 and weighted average of 28.5%. Similarly, the statistical analysis conducted on geographies consisting of 573,982,396 people shows a significant positive correlation between the proportion of Italians and percentage of family households with children in the United States with a correlation coefficient (R) of 0.693 and weighted average of 26.8%, a difference of 6.2%.
Family Households with Children Correlation Summary
| Measurement | Laotian | Italian |
| Minimum | 8.4% | 8.3% |
| Maximum | 52.5% | 100.0% |
| Range | 44.2% | 91.7% |
| Mean | 30.1% | 33.8% |
| Median | 30.6% | 27.7% |
| Interquartile 25% (IQ1) | 24.9% | 26.0% |
| Interquartile 75% (IQ3) | 35.4% | 31.4% |
| Interquartile Range (IQR) | 10.5% | 5.4% |
| Standard Deviation (Sample) | 8.9% | 17.3% |
| Standard Deviation (Population) | 8.8% | 17.3% |
Similar Demographics by Family Households with Children
Demographics Similar to Laotians by Family Households with Children
In terms of family households with children, the demographic groups most similar to Laotians are Iraqi (28.5%, a difference of 0.010%), Immigrants from Indonesia (28.5%, a difference of 0.040%), Burmese (28.5%, a difference of 0.060%), Immigrants from Honduras (28.5%, a difference of 0.070%), and Immigrants from Korea (28.5%, a difference of 0.12%).
| Demographics | Rating | Rank | Family Households with Children |
| Ghanaians | 99.9 /100 | #67 | Exceptional 28.5% |
| Houma | 99.9 /100 | #68 | Exceptional 28.5% |
| Immigrants | Korea | 99.9 /100 | #69 | Exceptional 28.5% |
| Immigrants | Honduras | 99.9 /100 | #70 | Exceptional 28.5% |
| Burmese | 99.9 /100 | #71 | Exceptional 28.5% |
| Immigrants | Indonesia | 99.9 /100 | #72 | Exceptional 28.5% |
| Iraqis | 99.9 /100 | #73 | Exceptional 28.5% |
| Laotians | 99.9 /100 | #74 | Exceptional 28.5% |
| Immigrants | Jordan | 99.9 /100 | #75 | Exceptional 28.4% |
| Immigrants | Sri Lanka | 99.9 /100 | #76 | Exceptional 28.4% |
| Nigerians | 99.8 /100 | #77 | Exceptional 28.4% |
| Immigrants | Nepal | 99.8 /100 | #78 | Exceptional 28.4% |
| Immigrants | Iraq | 99.8 /100 | #79 | Exceptional 28.4% |
| Natives/Alaskans | 99.8 /100 | #80 | Exceptional 28.4% |
| South Americans | 99.8 /100 | #81 | Exceptional 28.4% |
Demographics Similar to Italians by Family Households with Children
In terms of family households with children, the demographic groups most similar to Italians are Immigrants from Scotland (26.8%, a difference of 0.030%), German Russian (26.8%, a difference of 0.030%), Scotch-Irish (26.8%, a difference of 0.050%), Irish (26.8%, a difference of 0.080%), and Slavic (26.8%, a difference of 0.090%).
| Demographics | Rating | Rank | Family Households with Children |
| Jamaicans | 2.5 /100 | #246 | Tragic 26.9% |
| Potawatomi | 2.2 /100 | #247 | Tragic 26.9% |
| Immigrants | Kazakhstan | 2.2 /100 | #248 | Tragic 26.9% |
| Immigrants | Eastern Europe | 2.1 /100 | #249 | Tragic 26.9% |
| Belgians | 2.1 /100 | #250 | Tragic 26.9% |
| Immigrants | Bosnia and Herzegovina | 1.9 /100 | #251 | Tragic 26.8% |
| Irish | 1.8 /100 | #252 | Tragic 26.8% |
| Italians | 1.5 /100 | #253 | Tragic 26.8% |
| Immigrants | Scotland | 1.5 /100 | #254 | Tragic 26.8% |
| German Russians | 1.5 /100 | #255 | Tragic 26.8% |
| Scotch-Irish | 1.4 /100 | #256 | Tragic 26.8% |
| Slavs | 1.3 /100 | #257 | Tragic 26.8% |
| Immigrants | Cuba | 1.3 /100 | #258 | Tragic 26.8% |
| Immigrants | Lithuania | 1.2 /100 | #259 | Tragic 26.8% |
| Immigrants | Jamaica | 1.2 /100 | #260 | Tragic 26.8% |