Pueblo vs Italian Family Poverty
COMPARE
Pueblo
Italian
Family Poverty
Family Poverty Comparison
Pueblo
Italians
17.0%
FAMILY POVERTY
0.0/ 100
METRIC RATING
340th/ 347
METRIC RANK
7.4%
FAMILY POVERTY
99.6/ 100
METRIC RATING
30th/ 347
METRIC RANK
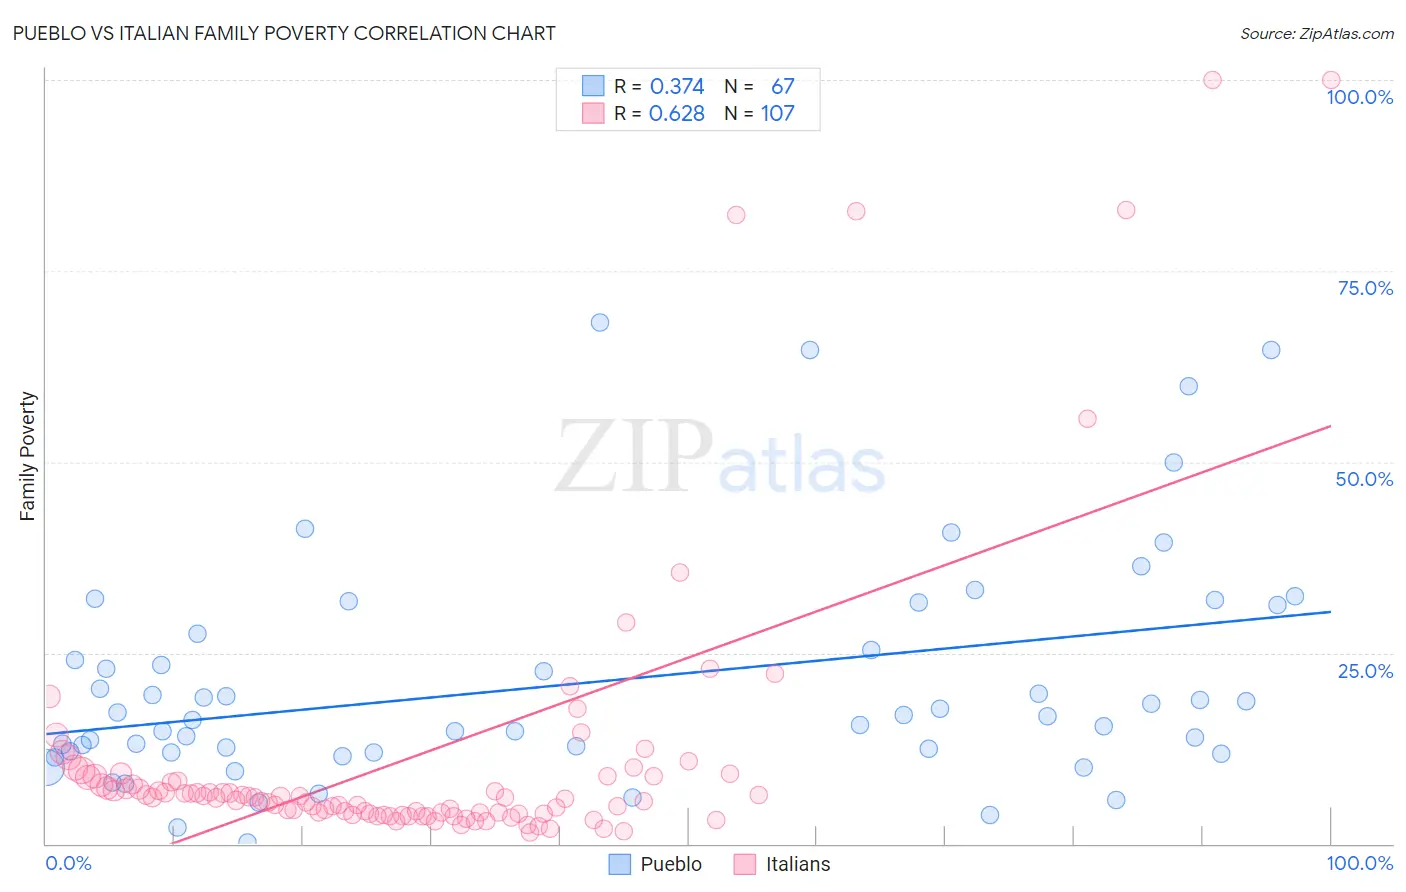
Pueblo vs Italian Family Poverty Correlation Chart
The statistical analysis conducted on geographies consisting of 120,003,274 people shows a mild positive correlation between the proportion of Pueblo and poverty level among families in the United States with a correlation coefficient (R) of 0.374 and weighted average of 17.0%. Similarly, the statistical analysis conducted on geographies consisting of 569,861,523 people shows a significant positive correlation between the proportion of Italians and poverty level among families in the United States with a correlation coefficient (R) of 0.628 and weighted average of 7.4%, a difference of 129.4%.
Family Poverty Correlation Summary
| Measurement | Pueblo | Italian |
| Minimum | 0.20% | 1.5% |
| Maximum | 68.2% | 100.0% |
| Range | 68.0% | 98.5% |
| Mean | 21.1% | 11.4% |
| Median | 16.7% | 6.1% |
| Interquartile 25% (IQ1) | 12.0% | 4.0% |
| Interquartile 75% (IQ3) | 27.5% | 8.8% |
| Interquartile Range (IQR) | 15.5% | 4.8% |
| Standard Deviation (Sample) | 15.0% | 18.9% |
| Standard Deviation (Population) | 14.8% | 18.8% |
Similar Demographics by Family Poverty
Demographics Similar to Pueblo by Family Poverty
In terms of family poverty, the demographic groups most similar to Pueblo are Lumbee (17.0%, a difference of 0.070%), Yuman (16.6%, a difference of 2.1%), Immigrants from Yemen (17.5%, a difference of 2.8%), Crow (16.1%, a difference of 5.4%), and Hopi (15.9%, a difference of 6.6%).
| Demographics | Rating | Rank | Family Poverty |
| Immigrants | Dominican Republic | 0.0 /100 | #333 | Tragic 14.4% |
| Houma | 0.0 /100 | #334 | Tragic 14.6% |
| Apache | 0.0 /100 | #335 | Tragic 14.7% |
| Sioux | 0.0 /100 | #336 | Tragic 15.9% |
| Hopi | 0.0 /100 | #337 | Tragic 15.9% |
| Crow | 0.0 /100 | #338 | Tragic 16.1% |
| Yuman | 0.0 /100 | #339 | Tragic 16.6% |
| Pueblo | 0.0 /100 | #340 | Tragic 17.0% |
| Lumbee | 0.0 /100 | #341 | Tragic 17.0% |
| Immigrants | Yemen | 0.0 /100 | #342 | Tragic 17.5% |
| Pima | 0.0 /100 | #343 | Tragic 18.4% |
| Yup'ik | 0.0 /100 | #344 | Tragic 18.7% |
| Navajo | 0.0 /100 | #345 | Tragic 18.8% |
| Puerto Ricans | 0.0 /100 | #346 | Tragic 20.3% |
| Tohono O'odham | 0.0 /100 | #347 | Tragic 20.4% |
Demographics Similar to Italians by Family Poverty
In terms of family poverty, the demographic groups most similar to Italians are Czech (7.4%, a difference of 0.12%), Immigrants from Northern Europe (7.4%, a difference of 0.29%), Polish (7.4%, a difference of 0.42%), Immigrants from Japan (7.4%, a difference of 0.42%), and Immigrants from Korea (7.4%, a difference of 0.46%).
| Demographics | Rating | Rank | Family Poverty |
| Assyrians/Chaldeans/Syriacs | 99.7 /100 | #23 | Exceptional 7.3% |
| Croatians | 99.7 /100 | #24 | Exceptional 7.3% |
| Burmese | 99.7 /100 | #25 | Exceptional 7.3% |
| Cypriots | 99.6 /100 | #26 | Exceptional 7.3% |
| Immigrants | Scotland | 99.6 /100 | #27 | Exceptional 7.3% |
| Immigrants | Korea | 99.6 /100 | #28 | Exceptional 7.4% |
| Immigrants | Northern Europe | 99.6 /100 | #29 | Exceptional 7.4% |
| Italians | 99.6 /100 | #30 | Exceptional 7.4% |
| Czechs | 99.6 /100 | #31 | Exceptional 7.4% |
| Poles | 99.5 /100 | #32 | Exceptional 7.4% |
| Immigrants | Japan | 99.5 /100 | #33 | Exceptional 7.4% |
| Russians | 99.5 /100 | #34 | Exceptional 7.5% |
| Greeks | 99.4 /100 | #35 | Exceptional 7.5% |
| Turks | 99.4 /100 | #36 | Exceptional 7.5% |
| Estonians | 99.4 /100 | #37 | Exceptional 7.5% |