Laotian vs Immigrants from Moldova Family Poverty
COMPARE
Laotian
Immigrants from Moldova
Family Poverty
Family Poverty Comparison
Laotians
Immigrants from Moldova
8.1%
FAMILY POVERTY
95.6/ 100
METRIC RATING
105th/ 347
METRIC RANK
7.7%
FAMILY POVERTY
98.8/ 100
METRIC RATING
51st/ 347
METRIC RANK
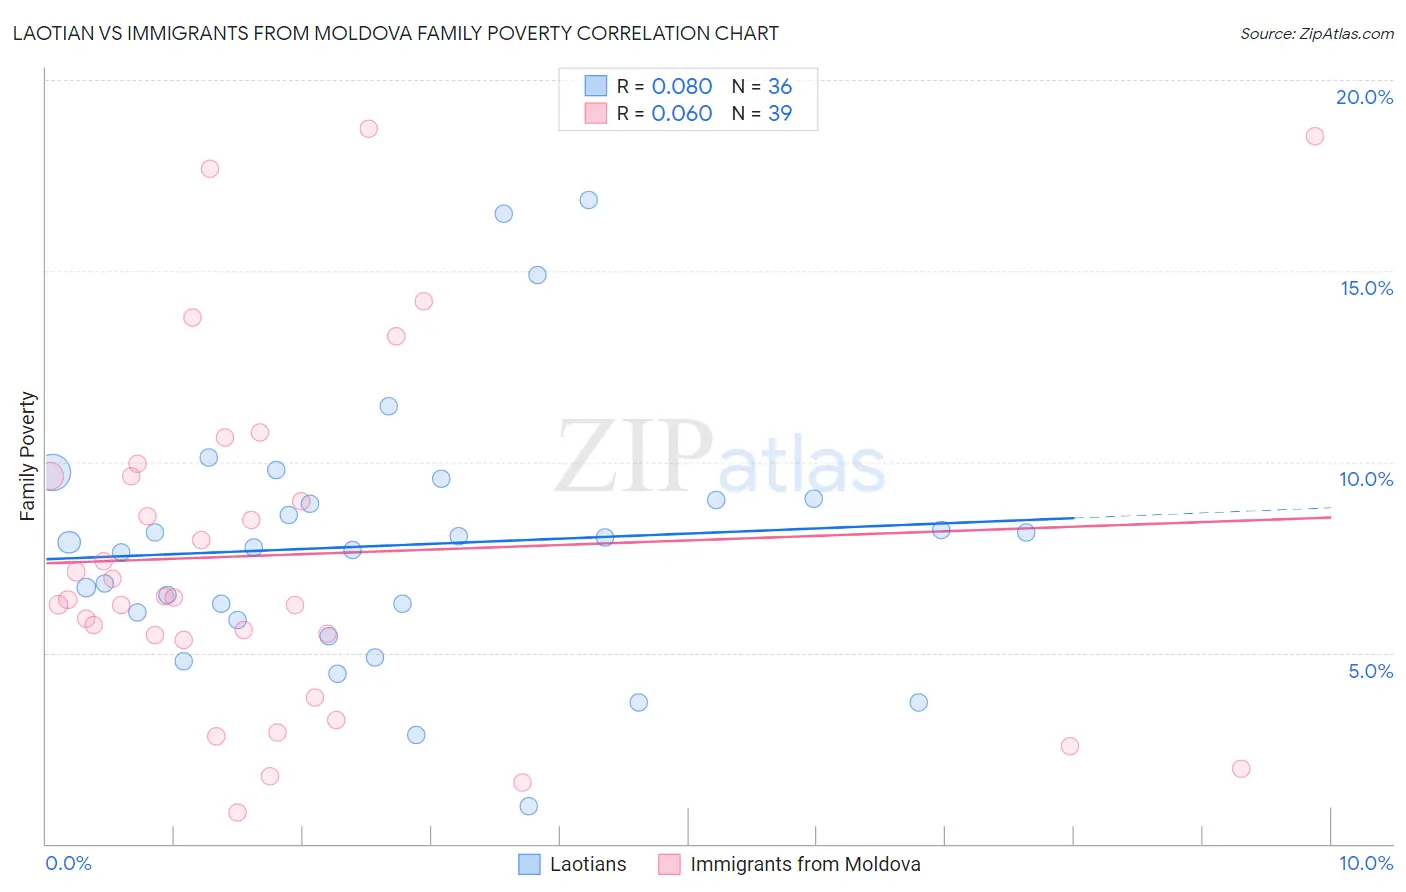
Laotian vs Immigrants from Moldova Family Poverty Correlation Chart
The statistical analysis conducted on geographies consisting of 224,550,821 people shows a slight positive correlation between the proportion of Laotians and poverty level among families in the United States with a correlation coefficient (R) of 0.080 and weighted average of 8.1%. Similarly, the statistical analysis conducted on geographies consisting of 124,316,177 people shows a slight positive correlation between the proportion of Immigrants from Moldova and poverty level among families in the United States with a correlation coefficient (R) of 0.060 and weighted average of 7.7%, a difference of 5.2%.
Family Poverty Correlation Summary
| Measurement | Laotian | Immigrants from Moldova |
| Minimum | 0.98% | 0.83% |
| Maximum | 16.8% | 18.7% |
| Range | 15.9% | 17.9% |
| Mean | 7.8% | 7.6% |
| Median | 7.8% | 6.4% |
| Interquartile 25% (IQ1) | 6.0% | 5.3% |
| Interquartile 75% (IQ3) | 9.0% | 9.6% |
| Interquartile Range (IQR) | 3.1% | 4.3% |
| Standard Deviation (Sample) | 3.4% | 4.5% |
| Standard Deviation (Population) | 3.3% | 4.5% |
Similar Demographics by Family Poverty
Demographics Similar to Laotians by Family Poverty
In terms of family poverty, the demographic groups most similar to Laotians are Slavic (8.1%, a difference of 0.030%), Immigrants from Eastern Europe (8.1%, a difference of 0.040%), Immigrants from Indonesia (8.1%, a difference of 0.13%), Immigrants from Norway (8.1%, a difference of 0.14%), and New Zealander (8.1%, a difference of 0.17%).
| Demographics | Rating | Rank | Family Poverty |
| Immigrants | South Africa | 95.9 /100 | #98 | Exceptional 8.1% |
| Welsh | 95.8 /100 | #99 | Exceptional 8.1% |
| New Zealanders | 95.8 /100 | #100 | Exceptional 8.1% |
| Immigrants | Norway | 95.7 /100 | #101 | Exceptional 8.1% |
| Immigrants | Indonesia | 95.7 /100 | #102 | Exceptional 8.1% |
| Immigrants | Eastern Europe | 95.6 /100 | #103 | Exceptional 8.1% |
| Slavs | 95.6 /100 | #104 | Exceptional 8.1% |
| Laotians | 95.6 /100 | #105 | Exceptional 8.1% |
| Egyptians | 95.1 /100 | #106 | Exceptional 8.1% |
| French Canadians | 95.0 /100 | #107 | Exceptional 8.1% |
| Basques | 94.9 /100 | #108 | Exceptional 8.1% |
| Jordanians | 94.8 /100 | #109 | Exceptional 8.2% |
| Romanians | 94.7 /100 | #110 | Exceptional 8.2% |
| Taiwanese | 94.6 /100 | #111 | Exceptional 8.2% |
| Immigrants | France | 94.4 /100 | #112 | Exceptional 8.2% |
Demographics Similar to Immigrants from Moldova by Family Poverty
In terms of family poverty, the demographic groups most similar to Immigrants from Moldova are Immigrants from North Macedonia (7.7%, a difference of 0.15%), Indian (Asian) (7.7%, a difference of 0.16%), Immigrants from Bolivia (7.7%, a difference of 0.18%), Swiss (7.7%, a difference of 0.22%), and Immigrants from Sweden (7.7%, a difference of 0.23%).
| Demographics | Rating | Rank | Family Poverty |
| Germans | 99.0 /100 | #44 | Exceptional 7.7% |
| Okinawans | 98.9 /100 | #45 | Exceptional 7.7% |
| Tongans | 98.9 /100 | #46 | Exceptional 7.7% |
| Immigrants | Czechoslovakia | 98.9 /100 | #47 | Exceptional 7.7% |
| Immigrants | Sri Lanka | 98.9 /100 | #48 | Exceptional 7.7% |
| Immigrants | Bolivia | 98.9 /100 | #49 | Exceptional 7.7% |
| Immigrants | North Macedonia | 98.9 /100 | #50 | Exceptional 7.7% |
| Immigrants | Moldova | 98.8 /100 | #51 | Exceptional 7.7% |
| Indians (Asian) | 98.8 /100 | #52 | Exceptional 7.7% |
| Swiss | 98.8 /100 | #53 | Exceptional 7.7% |
| Immigrants | Sweden | 98.8 /100 | #54 | Exceptional 7.7% |
| Immigrants | Eastern Asia | 98.7 /100 | #55 | Exceptional 7.7% |
| Immigrants | Serbia | 98.7 /100 | #56 | Exceptional 7.7% |
| Asians | 98.7 /100 | #57 | Exceptional 7.7% |
| Finns | 98.7 /100 | #58 | Exceptional 7.7% |