Immigrants from Denmark vs Italian Family Poverty
COMPARE
Immigrants from Denmark
Italian
Family Poverty
Family Poverty Comparison
Immigrants from Denmark
Italians
8.0%
FAMILY POVERTY
97.1/ 100
METRIC RATING
89th/ 347
METRIC RANK
7.4%
FAMILY POVERTY
99.6/ 100
METRIC RATING
30th/ 347
METRIC RANK
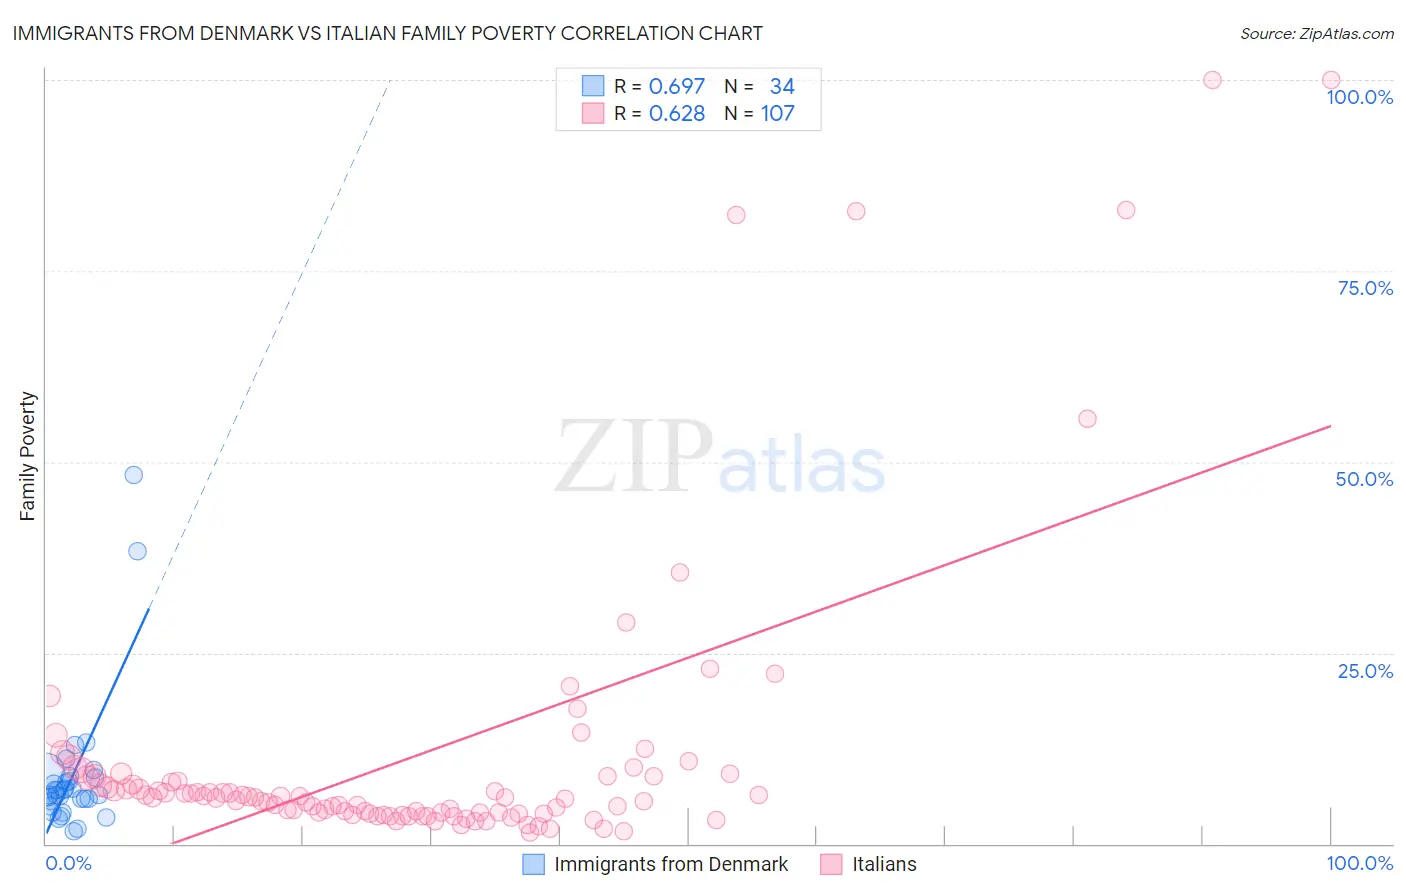
Immigrants from Denmark vs Italian Family Poverty Correlation Chart
The statistical analysis conducted on geographies consisting of 136,272,290 people shows a significant positive correlation between the proportion of Immigrants from Denmark and poverty level among families in the United States with a correlation coefficient (R) of 0.697 and weighted average of 8.0%. Similarly, the statistical analysis conducted on geographies consisting of 569,861,523 people shows a significant positive correlation between the proportion of Italians and poverty level among families in the United States with a correlation coefficient (R) of 0.628 and weighted average of 7.4%, a difference of 7.6%.
Family Poverty Correlation Summary
| Measurement | Immigrants from Denmark | Italian |
| Minimum | 1.6% | 1.5% |
| Maximum | 48.3% | 100.0% |
| Range | 46.7% | 98.5% |
| Mean | 8.9% | 11.4% |
| Median | 6.7% | 6.1% |
| Interquartile 25% (IQ1) | 5.5% | 4.0% |
| Interquartile 75% (IQ3) | 8.7% | 8.8% |
| Interquartile Range (IQR) | 3.2% | 4.8% |
| Standard Deviation (Sample) | 9.2% | 18.9% |
| Standard Deviation (Population) | 9.1% | 18.8% |
Similar Demographics by Family Poverty
Demographics Similar to Immigrants from Denmark by Family Poverty
In terms of family poverty, the demographic groups most similar to Immigrants from Denmark are Immigrants from England (8.0%, a difference of 0.0%), Serbian (8.0%, a difference of 0.15%), Immigrants from Italy (8.0%, a difference of 0.16%), Belgian (8.0%, a difference of 0.21%), and Scottish (7.9%, a difference of 0.30%).
| Demographics | Rating | Rank | Family Poverty |
| Immigrants | Poland | 97.8 /100 | #82 | Exceptional 7.9% |
| Slovaks | 97.7 /100 | #83 | Exceptional 7.9% |
| British | 97.5 /100 | #84 | Exceptional 7.9% |
| Immigrants | Asia | 97.4 /100 | #85 | Exceptional 7.9% |
| Scottish | 97.3 /100 | #86 | Exceptional 7.9% |
| Belgians | 97.3 /100 | #87 | Exceptional 8.0% |
| Serbians | 97.2 /100 | #88 | Exceptional 8.0% |
| Immigrants | Denmark | 97.1 /100 | #89 | Exceptional 8.0% |
| Immigrants | England | 97.1 /100 | #90 | Exceptional 8.0% |
| Immigrants | Italy | 97.0 /100 | #91 | Exceptional 8.0% |
| Czechoslovakians | 96.8 /100 | #92 | Exceptional 8.0% |
| Tlingit-Haida | 96.7 /100 | #93 | Exceptional 8.0% |
| Immigrants | Pakistan | 96.6 /100 | #94 | Exceptional 8.0% |
| Immigrants | Philippines | 96.5 /100 | #95 | Exceptional 8.0% |
| Immigrants | Turkey | 96.5 /100 | #96 | Exceptional 8.0% |
Demographics Similar to Italians by Family Poverty
In terms of family poverty, the demographic groups most similar to Italians are Czech (7.4%, a difference of 0.12%), Immigrants from Northern Europe (7.4%, a difference of 0.29%), Polish (7.4%, a difference of 0.42%), Immigrants from Japan (7.4%, a difference of 0.42%), and Immigrants from Korea (7.4%, a difference of 0.46%).
| Demographics | Rating | Rank | Family Poverty |
| Assyrians/Chaldeans/Syriacs | 99.7 /100 | #23 | Exceptional 7.3% |
| Croatians | 99.7 /100 | #24 | Exceptional 7.3% |
| Burmese | 99.7 /100 | #25 | Exceptional 7.3% |
| Cypriots | 99.6 /100 | #26 | Exceptional 7.3% |
| Immigrants | Scotland | 99.6 /100 | #27 | Exceptional 7.3% |
| Immigrants | Korea | 99.6 /100 | #28 | Exceptional 7.4% |
| Immigrants | Northern Europe | 99.6 /100 | #29 | Exceptional 7.4% |
| Italians | 99.6 /100 | #30 | Exceptional 7.4% |
| Czechs | 99.6 /100 | #31 | Exceptional 7.4% |
| Poles | 99.5 /100 | #32 | Exceptional 7.4% |
| Immigrants | Japan | 99.5 /100 | #33 | Exceptional 7.4% |
| Russians | 99.5 /100 | #34 | Exceptional 7.5% |
| Greeks | 99.4 /100 | #35 | Exceptional 7.5% |
| Turks | 99.4 /100 | #36 | Exceptional 7.5% |
| Estonians | 99.4 /100 | #37 | Exceptional 7.5% |