Laotian vs Bolivian Family Poverty
COMPARE
Laotian
Bolivian
Family Poverty
Family Poverty Comparison
Laotians
Bolivians
8.1%
FAMILY POVERTY
95.6/ 100
METRIC RATING
105th/ 347
METRIC RANK
7.5%
FAMILY POVERTY
99.3/ 100
METRIC RATING
38th/ 347
METRIC RANK
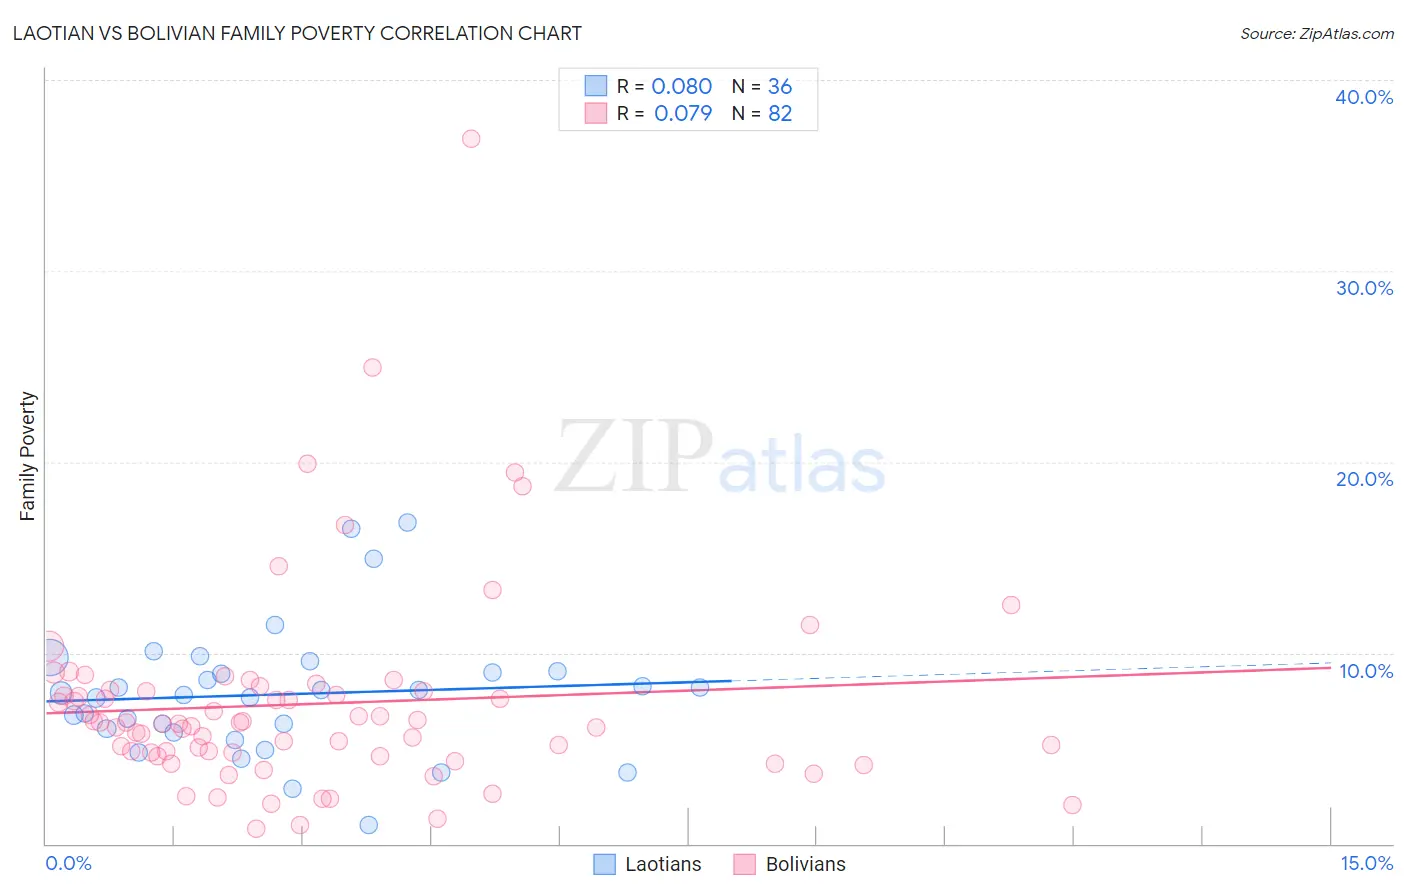
Laotian vs Bolivian Family Poverty Correlation Chart
The statistical analysis conducted on geographies consisting of 224,550,821 people shows a slight positive correlation between the proportion of Laotians and poverty level among families in the United States with a correlation coefficient (R) of 0.080 and weighted average of 8.1%. Similarly, the statistical analysis conducted on geographies consisting of 184,453,114 people shows a slight positive correlation between the proportion of Bolivians and poverty level among families in the United States with a correlation coefficient (R) of 0.079 and weighted average of 7.5%, a difference of 7.4%.
Family Poverty Correlation Summary
| Measurement | Laotian | Bolivian |
| Minimum | 0.98% | 0.79% |
| Maximum | 16.8% | 36.9% |
| Range | 15.9% | 36.2% |
| Mean | 7.8% | 7.3% |
| Median | 7.8% | 6.3% |
| Interquartile 25% (IQ1) | 6.0% | 4.8% |
| Interquartile 75% (IQ3) | 9.0% | 8.0% |
| Interquartile Range (IQR) | 3.1% | 3.2% |
| Standard Deviation (Sample) | 3.4% | 5.4% |
| Standard Deviation (Population) | 3.3% | 5.4% |
Similar Demographics by Family Poverty
Demographics Similar to Laotians by Family Poverty
In terms of family poverty, the demographic groups most similar to Laotians are Slavic (8.1%, a difference of 0.030%), Immigrants from Eastern Europe (8.1%, a difference of 0.040%), Immigrants from Indonesia (8.1%, a difference of 0.13%), Immigrants from Norway (8.1%, a difference of 0.14%), and New Zealander (8.1%, a difference of 0.17%).
| Demographics | Rating | Rank | Family Poverty |
| Immigrants | South Africa | 95.9 /100 | #98 | Exceptional 8.1% |
| Welsh | 95.8 /100 | #99 | Exceptional 8.1% |
| New Zealanders | 95.8 /100 | #100 | Exceptional 8.1% |
| Immigrants | Norway | 95.7 /100 | #101 | Exceptional 8.1% |
| Immigrants | Indonesia | 95.7 /100 | #102 | Exceptional 8.1% |
| Immigrants | Eastern Europe | 95.6 /100 | #103 | Exceptional 8.1% |
| Slavs | 95.6 /100 | #104 | Exceptional 8.1% |
| Laotians | 95.6 /100 | #105 | Exceptional 8.1% |
| Egyptians | 95.1 /100 | #106 | Exceptional 8.1% |
| French Canadians | 95.0 /100 | #107 | Exceptional 8.1% |
| Basques | 94.9 /100 | #108 | Exceptional 8.1% |
| Jordanians | 94.8 /100 | #109 | Exceptional 8.2% |
| Romanians | 94.7 /100 | #110 | Exceptional 8.2% |
| Taiwanese | 94.6 /100 | #111 | Exceptional 8.2% |
| Immigrants | France | 94.4 /100 | #112 | Exceptional 8.2% |
Demographics Similar to Bolivians by Family Poverty
In terms of family poverty, the demographic groups most similar to Bolivians are Carpatho Rusyn (7.5%, a difference of 0.060%), Slovene (7.5%, a difference of 0.10%), Estonian (7.5%, a difference of 0.24%), Immigrants from Australia (7.6%, a difference of 0.40%), and Turkish (7.5%, a difference of 0.41%).
| Demographics | Rating | Rank | Family Poverty |
| Czechs | 99.6 /100 | #31 | Exceptional 7.4% |
| Poles | 99.5 /100 | #32 | Exceptional 7.4% |
| Immigrants | Japan | 99.5 /100 | #33 | Exceptional 7.4% |
| Russians | 99.5 /100 | #34 | Exceptional 7.5% |
| Greeks | 99.4 /100 | #35 | Exceptional 7.5% |
| Turks | 99.4 /100 | #36 | Exceptional 7.5% |
| Estonians | 99.4 /100 | #37 | Exceptional 7.5% |
| Bolivians | 99.3 /100 | #38 | Exceptional 7.5% |
| Carpatho Rusyns | 99.3 /100 | #39 | Exceptional 7.5% |
| Slovenes | 99.3 /100 | #40 | Exceptional 7.5% |
| Immigrants | Australia | 99.2 /100 | #41 | Exceptional 7.6% |
| Scandinavians | 99.1 /100 | #42 | Exceptional 7.6% |
| Immigrants | Austria | 99.1 /100 | #43 | Exceptional 7.6% |
| Germans | 99.0 /100 | #44 | Exceptional 7.7% |
| Okinawans | 98.9 /100 | #45 | Exceptional 7.7% |